What is Amazon Marketing Cloud?
Amazon Marketing Cloud (AMC) is Amazon's clean room analytics environment that lets advertisers run custom SQL queries across their advertising and retail data. Unlike standard Amazon reporting, AMC lets you join purchase history with ad impressions, clicks, and conversions at the user level, unlocking insights like customer lifetime value, cross-sell paths, organic vs. paid acquisition, and full-funnel attribution.
This guide provides 15 production-tested SQL queries that you can copy and run directly in your AMC instance. Each query has been optimized for AMC's SQL dialect, tested against real data, and includes analysis recommendations for turning raw output into actionable insights.
Who This Guide Is For
This guide is for Amazon advertisers, brand managers, and agencies who have access to AMC and want to build customer analytics, LTV reports, or attribution models. You should be comfortable with basic SQL concepts (SELECT, JOIN, GROUP BY), though every query is provided ready to run.
Key AMC Rules & Gotchas
AMC has a unique SQL dialect with specific limitations, reserved words, unit conversions, and date column traps that will save you hours of debugging. For the full reference, see the AMC Complete Reference Guide →
Paid vs. Free AMC Tables
Not all AMC tables are available on the free tier. Amazon offers paid data subscriptions (such as Flexible Shopping Insights) that unlock additional tables beyond what's included with base AMC access. If you try to run a query that references a paid table you haven't subscribed to, the query will fail with an error.
The following tables used in this guide require an active Amazon paid data subscription:
amazon_retail_purchases: required for Q1, Q2, Q4, Q5, Q6, Q10, Q12, Q13, Q15conversions_all: required for Q3
The remaining 5 queries (Q7, Q8, Q9, Q11, Q14) use only standard tables included with base AMC access: sponsored_ads_traffic, dsp_impressions, dsp_clicks, and amazon_attributed_events_by_conversion_time.
How to check: In your AMC instance, open the Paid Features tab to see which subscriptions are active. Amazon has made its first-party paid features, including Amazon Retail Purchases, free to subscribe through December 31, 2026. If you don't see the option to opt in, reach out to your Amazon rep to get access.
Throughout this guide, queries requiring paid tables are flagged with a 💲 Paid table badge, and free queries are marked ✓ Free.
The Four Query Categories
The 15 queries are organized into four categories, each targeting a different aspect of your Amazon business:
- Q1 Monthly Revenue & Customers
- Q2 Purchase Frequency
- Q3 Subscribe & Save
- Q4 Cohort LTV Analysis
- Q5 Cross-Sell Paths
- Q6 Time to Second Purchase
- Q7 Sponsored Ads Spend
- Q8 DSP Spend by Campaign
- Q9 SB/SBV/SD Spend
- Q10 Organic vs Paid First Touch
- Q11 Full-Funnel Attribution
- Q12 Organic vs Paid by ASIN
- Q13 NTB vs Repeat by ASIN
- Q14 First-Touch Attribution
- Q15 Path to Purchase
How AMC Data Flows
Understanding the end-to-end workflow, from raw AMC tables to actionable dashboards:
Quick Reference Table
All 15 queries at a glance. Click any query name to jump to its full documentation.
| # | Query Name | Category | Tables Used | Subscription | Est. Rows |
|---|---|---|---|---|---|
| Q1 | Monthly Revenue & Customers by ASIN | Revenue | amazon_retail_purchases |
💲 Paid | ~600 |
| Q2 | Purchase Frequency Distribution | Revenue | amazon_retail_purchases |
💲 Paid | ~5 |
| Q3 | Subscribe & Save Analysis | Revenue | conversions_all |
💲 Paid | ~5,600 |
| Q4 | Cohort LTV Analysis | LTV | amazon_retail_purchases |
💲 Paid | ~1,800 |
| Q5 | Cross-Sell Paths | LTV | amazon_retail_purchases |
💲 Paid | ~4,600 |
| Q6 | Time to Second Purchase | LTV | amazon_retail_purchases |
💲 Paid | ~185 |
| Q7 | Sponsored Ads Spend by ASIN | Spend | sponsored_ads_traffic |
✓ Free | ~1,500 |
| Q8 | DSP Spend by Campaign | Spend | dsp_impressions |
✓ Free | ~175 |
| Q9 | SB/SBV/SD Spend by Campaign | Spend | sponsored_ads_traffic |
✓ Free | ~200 |
| Q10 | Organic vs Paid First Touch | Attribution | amazon_retail_purchases sponsored_ads_traffic dsp_clicks |
💲 Paid | ~120 |
| Q11 | Full-Funnel Attribution | Attribution | amazon_attributed_events_by_conversion_time |
✓ Free | ~19,000 |
| Q12 | Organic vs Paid by ASIN | Attribution | amazon_retail_purchases sponsored_ads_traffic dsp_clicks |
💲 Paid | ~3,000–5,000 |
| Q13 | NTB vs Repeat by ASIN | Attribution | amazon_retail_purchases |
💲 Paid | ~5,000–10,000 |
| Q14 | First-Touch Attribution by Channel | Attribution | amazon_attributed_events_by_conversion_time sponsored_ads_traffic dsp_impressions |
✓ Free | ~5 |
| Q15 | Path to Purchase | Attribution | sponsored_ads_traffic dsp_impressions amazon_retail_purchases |
💲 Paid | ~500–2,000 |
Revenue & Customer Analytics
These queries extract core business metrics from amazon_retail_purchases: monthly revenue, customer counts, purchase frequency, and subscription data. They form the foundation of any AMC analytics setup.
The foundational revenue query. Pulls monthly revenue, unique customer count, and units sold for every ASIN in your catalog. This is the starting point for any product-level financial analysis. Use it to identify top sellers, track growth trends, and build category-level dashboards.
Output Columns
| Column | Type | Description |
|---|---|---|
purchase_month | TIMESTAMP | First day of the month (truncated) |
asin | TEXT | Product ASIN |
asin_name | TEXT | Product name as stored in AMC |
unique_customers | INTEGER | Count of distinct buyers |
revenue | DECIMAL | Total revenue (unit_price × units_sold) |
units | INTEGER | Total units sold |
AMC Tables Used
SQL Query
Sample Output
Example data shown below is illustrative; actual outputs will vary based on your AMC instance and date range.
| purchase_month | asin | asin_name | unique_customers | revenue | units |
|---|---|---|---|---|---|
| 2026-01 | B0EXAMPLE01 | Cat Litter 40LB | 2,530 | $104,200 | 2,930 |
| 2026-01 | B0EXAMPLE02 | Puppy Pads 100ct | 1,110 | $28,200 | 1,280 |
| 2026-01 | B0EXAMPLE03 | Waste Bags 600ct | 930 | $18,800 | 1,010 |
| 2026-01 | B0EXAMPLE04 | Pet Shampoo 32oz | 680 | $16,200 | 770 |
| 2026-01 | B0EXAMPLE05 | Litter Mat XL | 590 | $15,000 | 660 |
| 2026-01 | B0EXAMPLE06 | Pet Wipes 400ct | 450 | $10,200 | 490 |
Revenue in amazon_retail_purchases is calculated from unit_price × purchase_units_sold. Unlike ad spend, this is already in dollars, so no conversion is needed.
Recommended Pivot Table Setup:
- Rows: ASIN (or product category tag)
- Columns: purchase_month
- Values: SUM of revenue, SUM of unique_customers
Best Chart Types:
- Line chart: Revenue trends over time by product category
- Stacked bar chart: Revenue composition by category per month
- Heatmap: ASIN × month matrix to spot seasonal patterns
Product Tagging: Create an ASIN-to-category mapping table (e.g., "Litter", "Grooming", "Training"). Add a VLOOKUP column to group ASINs into categories, then pivot by category for cleaner dashboards.
Calculated Fields to Add:
Revenue per Customer= revenue / unique_customersAverage Order Value= revenue / units (approximate)MoM Growth %= (this_month - last_month) / last_month
Segments your entire customer base by how many orders they've placed (1, 2, 3–5, 6–10, 11+). Reveals the repeat purchase rate and shows how LTV scales with purchase frequency. Essential for understanding customer retention and the value of repeat buyers.
Output Columns
| Column | Type | Description |
|---|---|---|
order_bucket | TEXT | Frequency segment (1_order, 2_orders, 3-5_orders, etc.) |
customers | INTEGER | Number of customers in this bucket |
avg_ltv | DECIMAL | Average lifetime revenue per customer |
avg_unique_products | DECIMAL | Average number of distinct ASINs purchased |
AMC Tables Used
SQL Query
Sample Output
Example data shown below is illustrative; actual outputs will vary based on your AMC instance and date range.
| order_bucket | customer_count | pct_of_total | avg_ltv | avg_units |
|---|---|---|---|---|
| 1 order | 23,050 | 68.2% | $32 | 1.2 |
| 2 orders | 5,920 | 17.5% | $71 | 2.6 |
| 3–5 orders | 3,440 | 10.2% | $134 | 5.1 |
| 6–10 orders | 1,010 | 3.0% | $292 | 11.3 |
| 11+ orders | 370 | 1.1% | $684 | 26.8 |
In most Amazon brands, 60% of customers are one-time buyers. But the 40% who come back often account for 70%+ of total revenue. This query quantifies that exact split for your brand.
Best Chart Types:
- Bar chart: Customers by order bucket (shows the distribution)
- Bar chart with secondary axis: Customers (bars) vs. avg_ltv (line) by bucket
- Pie/donut chart: % of total customers in each bucket
Calculated Fields to Add:
% of Total Customers= customers / SUM(customers)Total Revenue per Bucket= customers × avg_ltv (shows total revenue contribution)LTV Multiplier= avg_ltv / avg_ltv_of_1_order_bucket
Key Question to Answer: What is the LTV multiplier from 1-order to 2-orders? If it's 3x, every dollar spent driving repeat purchases generates 3x the value.
Adds the purchase_retail_program dimension to break out Subscribe & Save orders from standard purchases. Helps quantify subscription revenue and identify which products have the strongest S&S adoption. Note: S&S data availability varies by AMC instance.
Output Columns
| Column | Type | Description |
|---|---|---|
purchase_month | TIMESTAMP | First day of the month |
tracked_asin | TEXT | Product ASIN |
purchase_retail_program | TEXT | Purchase program (e.g., Subscribe & Save, or empty) |
units | INTEGER | Total units sold |
revenue | DECIMAL | Total revenue |
AMC Tables Used
SQL Query
Sample Output
Example data shown below is illustrative; actual outputs will vary based on your AMC instance and date range.
| purchase_month | tracked_asin | purchase_retail_program | units | revenue |
|---|---|---|---|---|
| 2026-01 | B0EXAMPLE01 | (empty) | 2,930 | $104,200 |
| 2026-01 | B0EXAMPLE02 | (empty) | 1,280 | $28,200 |
| 2026-01 | B0EXAMPLE03 | (empty) | 1,010 | $18,800 |
| 2026-01 | B0EXAMPLE04 | (empty) | 770 | $16,200 |
purchase_retail_program field returned empty for all rows. This is common when the AMC instance doesn't have Subscribe & Save data populated, or when the brand doesn't have S&S enabled on their products. The query still runs; it just won't differentiate between S&S and one-time purchases.
| purchase_month | tracked_asin | purchase_retail_program | units | revenue |
|---|---|---|---|---|
| 2026-01 | B0EXAMPLE01 | Subscribe & Save | 1,150 | $39,000 |
| 2026-01 | B0EXAMPLE01 | One-Time Purchase | 1,780 | $65,200 |
| 2026-01 | B0EXAMPLE02 | Subscribe & Save | 370 | $8,000 |
| 2026-01 | B0EXAMPLE02 | One-Time Purchase | 910 | $20,200 |
purchase_retail_program may return empty for all rows in some AMC instances. This is a known limitation: S&S data availability varies. You can also check for sns_subscription_id in conversions_all as an alternative indicator.
Recommended Pivot Table Setup:
- Rows: ASIN or product category
- Columns: purchase_retail_program
- Values: SUM of revenue, SUM of units
Best Chart Types:
- Stacked bar: S&S vs standard revenue by product category
- Line chart: S&S adoption rate over time (S&S revenue / total revenue)
Calculated Fields:
S&S Adoption Rate= S&S revenue / total revenue per ASINS&S Revenue %= S&S revenue / total revenue (brand-wide)
If purchase_retail_program returns empty, this query still works as a basic revenue query with an extra empty column; use it as a fallback.
Customer Lifetime Value
These queries analyze customer behavior over time: cohort retention, cross-sell paths, and repurchase timing. Together they paint a complete picture of how customers interact with your brand after their first purchase.
Groups customers into monthly cohorts based on their first purchase date, then tracks their cumulative revenue and activity over subsequent months. This is the gold standard for LTV analysis. It shows you exactly how much revenue each cohort generates over time and whether your newer cohorts are more or less valuable than older ones.
Output Columns
| Column | Type | Description |
|---|---|---|
cohort_month | TIMESTAMP | Month of first purchase (defines the cohort) |
revenue_month | TIMESTAMP | Month when revenue was generated |
active_customers | INTEGER | Customers from the cohort who purchased in this month |
revenue | DECIMAL | Total revenue from this cohort in this month |
units | INTEGER | Total units sold |
AMC Tables Used
SQL Query
Sample Output
Example data shown below is illustrative; actual outputs will vary based on your AMC instance and date range.
| cohort_month | revenue_month | active_customers | revenue | units |
|---|---|---|---|---|
| 2025-07 | 2025-07 | 3,510 | $89,300 | 4,030 |
| 2025-07 | 2025-08 | 690 | $18,900 | 850 |
| 2025-07 | 2025-09 | 410 | $11,200 | 510 |
| 2025-08 | 2025-08 | 3,670 | $94,200 | 4,250 |
| 2025-08 | 2025-09 | 750 | $20,500 | 920 |
| 2025-09 | 2025-09 | 3,290 | $84,600 | 3,810 |
Post-export, calculate months_since_first = DATEDIF(cohort_month, revenue_month, "M") and create a cumulative sum of revenue per cohort. Plot these as line charts where X = months since first purchase and each line = a cohort. This gives you classic LTV curves showing how revenue accumulates over time.
Recommended Pivot Table Setup:
- Rows: cohort_month
- Columns: months_since_first (calculated: DATEDIF or manual month difference)
- Values: SUM of revenue (or CUMULATIVE SUM for LTV curves)
Best Chart Types:
- Line chart (LTV curves): X = months since acquisition, Y = cumulative revenue per customer, each line = a cohort. The most important chart in this guide.
- Heatmap: Cohort × month matrix showing revenue density. Dark cells = high activity.
- Retention chart: active_customers / cohort_size per month (requires joining with Q1 for initial cohort size)
Calculated Fields:
Months Since First= (YEAR(revenue_month) - YEAR(cohort_month)) × 12 + (MONTH(revenue_month) - MONTH(cohort_month))Cumulative Revenue= Running sum of revenue within each cohortLTV per Customer= Cumulative Revenue / Cohort SizeRetention Rate= active_customers / initial cohort size
Identifies what customers buy second after their first purchase. For each first-ASIN → second-ASIN pair, shows how many customers followed that path. Use this to optimize product bundling, recommendation widgets, and advertising strategy. Knowing that 500 customers who bought Product A next bought Product B is gold for targeting.
Output Columns
| Column | Type | Description |
|---|---|---|
first_asin | TEXT | The ASIN of the customer's first purchase |
second_asin | TEXT | The ASIN of the customer's second purchase |
customer_count | INTEGER | Number of customers who followed this path (min 10) |
AMC Tables Used
SQL Query
Sample Output
Example data shown below is illustrative; actual outputs will vary based on your AMC instance and date range.
| first_asin | first_product | second_asin | second_product | customer_count |
|---|---|---|---|---|
| B0EXAMPLE01 | Cat Litter 40LB | B0EXAMPLE01 | Cat Litter 40LB (repeat) | 1,700 |
| B0EXAMPLE01 | Cat Litter 40LB | B0EXAMPLE03 | Waste Bags 600ct | 370 |
| B0EXAMPLE02 | Puppy Pads | B0EXAMPLE02 | Puppy Pads (repeat) | 310 |
| B0EXAMPLE03 | Waste Bags | B0EXAMPLE01 | Cat Litter 40LB | 230 |
| B0EXAMPLE04 | Pet Shampoo | B0EXAMPLE04 | Pet Shampoo (repeat) | 210 |
| B0EXAMPLE01 | Cat Litter 40LB | B0EXAMPLE05 | Litter Mat XL | 130 |
The HAVING >= 10 filter removes noise from low-volume paths. If you want more granularity, lower it to 5, but be aware this increases output rows significantly. For brands with 100+ ASINs, keep it at 10 or higher.
Best Analysis Approach:
- Map ASINs to product names/categories using a VLOOKUP column
- Filter by a specific
first_asinto answer: "What do customers buy after buying Product X?" - Sort by
customer_countdescending (remember: sort post-export, not in AMC)
Best Chart Types:
- Horizontal bar chart: For a given entry product, top 10 second purchases by customer count
- Sankey diagram: First product → Second product flow (use a tool like SankeyMATIC)
- Pivot table: Rows = first_asin category, Columns = second_asin category, Values = SUM(customer_count)
Actionable Insights:
- If first_asin == second_asin for many customers → strong repurchase signal for that product
- High cross-sell pairs → create Amazon bundles or Sponsored Display retargeting campaigns
- Use top paths to inform DSP audience strategy: target buyers of Product A with ads for Product B
Measures how long it takes customers to come back for a second purchase, broken down by their first ASIN. Shows both average and median days to repeat. The median is more useful since a few extreme outliers can skew the average. Use this to time your retargeting campaigns and email follow-ups.
Output Columns
| Column | Type | Description |
|---|---|---|
first_asin | TEXT | The ASIN of the customer's first purchase |
customers_with_repeat | INTEGER | Number of customers who made a second purchase (min 10) |
avg_days_to_repeat | DECIMAL | Average days between first and second purchase |
median_days_to_repeat | DECIMAL | Median days between first and second purchase |
AMC Tables Used
SQL Query
Sample Output
Example data shown below is illustrative; actual outputs will vary based on your AMC instance and date range.
| first_asin | product_name | customers_with_repeat | avg_days | median_days |
|---|---|---|---|---|
| B0EXAMPLE01 | Cat Litter 40LB | 2,300 | 38.2 | 32 |
| B0EXAMPLE03 | Waste Bags 600ct | 670 | 42.6 | 36 |
| B0EXAMPLE02 | Puppy Pads 100ct | 570 | 45.1 | 38 |
| B0EXAMPLE04 | Pet Shampoo 32oz | 370 | 52.8 | 45 |
| B0EXAMPLE05 | Litter Mat XL | 290 | 48.3 | 41 |
| B0EXAMPLE06 | Pet Wipes 400ct | 190 | 56.4 | 48 |
AMC doesn't have a DATEDIFF function. Use SECONDS_BETWEEN(start, end) / 86400.0 to convert to days. This works with purchase_dt_utc (TIMESTAMP type); don't use the INTEGER date columns.
Best Chart Types:
- Bar chart: Median days to repeat by product category (sorted ascending)
- Scatter plot: X = median_days_to_repeat, Y = customers_with_repeat (identifies high-volume fast-repeat products)
Product Category Grouping: Map first_asin to categories, then calculate weighted averages within each category. Consumable products (litter, waste bags) should have shorter repeat cycles than durable goods.
Actionable Insights:
- If median is 45 days → schedule retargeting to start at day 30
- If avg ≫ median → you have long-tail repeat customers pulling the average up. The median is your true signal.
- Products with short repeat cycles are prime candidates for Subscribe & Save pushes
Semi-Automatic Campaign Management
You set the targets and guardrails. AdLabs handles bid optimization with math you can check, keeps your campaign structure clean with two-click harvesting, and logs every change. Spend less time in the weeds and more time scaling what works.
Try Free →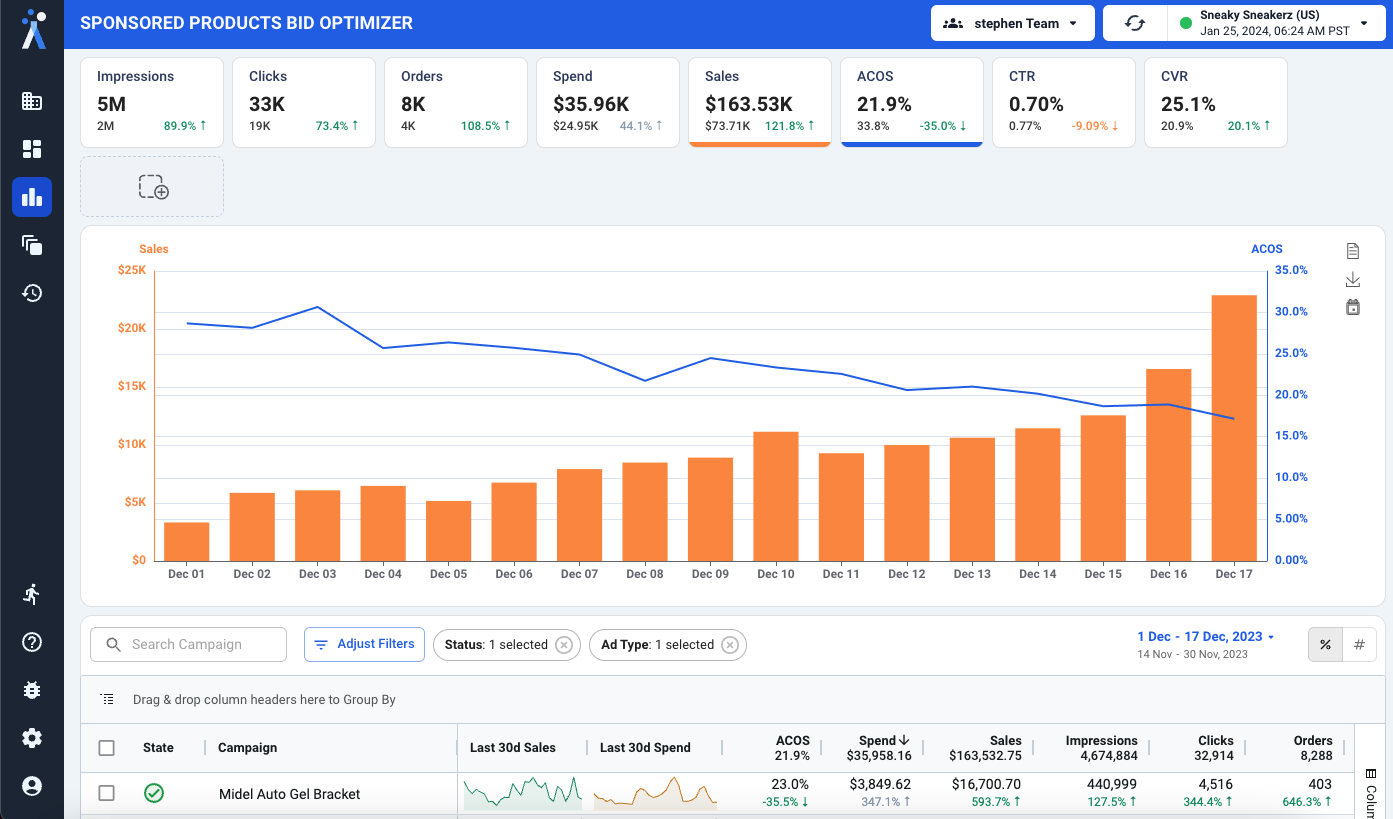
Ad Spend Tracking
These queries pull ad spend from Sponsored Ads and DSP, broken down by ASIN and campaign. Combined with the revenue queries in Category 1, they let you calculate true Customer Acquisition Cost (CAC) and ROAS at the product level.
Pulls monthly Sponsored Products, Brands, and Display spend broken down by the creative ASIN and ad product type. This is your primary spend-by-product query for Sponsored Ads. Note that SB/SBV campaigns may not have a creative_asin; use Q9 for campaign-level SB/SD spend.
Output Columns
| Column | Type | Description |
|---|---|---|
spend_month | TIMESTAMP | First day of the month |
creative_asin | TEXT | ASIN associated with the ad creative |
ad_product_type | TEXT | sponsored_products, sponsored_brands, or sponsored_display |
ad_spend_dollars | DECIMAL | Ad spend in dollars (converted from microcents) |
clicks | INTEGER | Total clicks |
impressions | INTEGER | Total impressions |
AMC Tables Used
SQL Query
Sample Output
Example data shown below is illustrative; actual outputs will vary based on your AMC instance and date range.
| spend_month | creative_asin | ad_product_type | spend | clicks | impressions |
|---|---|---|---|---|---|
| 2025-10 | B0EXAMPLE01 | Sponsored Products | $11,050 | 14,510 | 1,105,000 |
| 2025-10 | B0EXAMPLE01 | Sponsored Brands | $2,920 | 3,250 | 374,000 |
| 2025-10 | B0EXAMPLE01 | Sponsored Display | $1,280 | 1,910 | 292,000 |
| 2025-11 | B0EXAMPLE01 | Sponsored Products | $13,610 | 17,120 | 1,274,000 |
| 2025-11 | B0EXAMPLE01 | Sponsored Brands | $3,740 | 4,130 | 445,000 |
| 2025-11 | B0EXAMPLE01 | Sponsored Display | $1,910 | 2,710 | 341,000 |
Sponsored Ads spend is in microcents. Dividing by 100,000,000 (108) converts to dollars. If your spend looks like it's in the trillions, you forgot this step. If it looks like it's in the pennies, you divided by the wrong number.
Recommended Pivot Table Setup:
- Rows: creative_asin (mapped to product category)
- Columns: spend_month
- Values: SUM of ad_spend_dollars
- Filter: ad_product_type (to slice by SP vs SB vs SD)
Calculated Fields:
CPC= ad_spend_dollars / clicksCTR= clicks / impressionsCPM= (ad_spend_dollars / impressions) × 1000
Combine with Q1: Join this data with Q1 output on ASIN + month to calculate ACOS = ad_spend / revenue and CAC = ad_spend / new_customers.
Pulls monthly DSP spend at the campaign level from the dsp_impressions table. DSP campaigns don't have ASIN-level granularity in their spend data, so this groups by campaign name and ID. Use campaign naming conventions to map spend back to product categories.
Output Columns
| Column | Type | Description |
|---|---|---|
spend_month | TIMESTAMP | First day of the month |
campaign | TEXT | DSP campaign name |
campaign_id | TEXT | DSP campaign ID |
dsp_spend_dollars | DECIMAL | DSP spend in dollars (converted from millicents) |
impressions | INTEGER | Total impressions served |
AMC Tables Used
SQL Query
Sample Output
Example data shown below is illustrative; actual outputs will vary based on your AMC instance and date range.
| spend_month | campaign | dsp_spend_dollars | impressions |
|---|---|---|---|
| 2025-10 | Litter - DSP - Retargeting - Views | $5,050 | 1,284,000 |
| 2025-10 | Pet Care - DSP - Prospecting - InMarket | $3,170 | 1,116,000 |
| 2025-11 | Litter - DSP - Retargeting - Views | $6,980 | 1,704,000 |
| 2025-11 | Pet Care - DSP - Prospecting - InMarket | $4,270 | 1,428,000 |
| 2025-12 | Litter - DSP - Retargeting - Views | $5,920 | 1,512,000 |
DSP total_cost uses millicents (÷ 100,000 for dollars), while Sponsored Ads spend uses microcents (÷ 100,000,000). Don't mix them up; it's a 1,000x difference.
Recommended Pivot Table Setup:
- Rows: campaign (or extracted campaign category)
- Columns: spend_month
- Values: SUM of dsp_spend_dollars, SUM of impressions
Calculated Fields:
CPM= (dsp_spend_dollars / impressions) × 1000% of Total DSP Spend= campaign_spend / SUM(all_campaign_spend)
Campaign Category Mapping: If your DSP campaigns follow a naming convention (e.g., "Retargeting - Litter" or "Prospecting - Grooming"), extract the category prefix to group spend. Use LEFT(campaign, FIND(" - ", campaign)-1) or similar text formula.
Extracts Sponsored Brands (including SBV) and Sponsored Display spend at the campaign level. Unlike Q7 which groups by creative_asin, SB and SD campaigns often don't have a meaningful creative ASIN. This query uses campaign names, which typically contain category prefixes like "Litter - NBR - SBV...", to enable category-level spend mapping.
Output Columns
| Column | Type | Description |
|---|---|---|
spend_month | TIMESTAMP | First day of the month |
campaign | TEXT | Campaign name (contains category prefixes) |
ad_product_type | TEXT | sponsored_brands or sponsored_display |
ad_spend_dollars | DECIMAL | Spend in dollars (converted from microcents) |
clicks | INTEGER | Total clicks |
impressions | INTEGER | Total impressions |
AMC Tables Used
SQL Query
Sample Output
Example data shown below is illustrative; actual outputs will vary based on your AMC instance and date range.
| spend_month | campaign | ad_product_type | spend | clicks | impressions |
|---|---|---|---|---|---|
| 2025-10 | Brand - SB - Top of Search | Sponsored Brands | $1,940 | 2,320 | 251,000 |
| 2025-10 | Litter - SBV - Product Page | Sponsored Brands Video | $970 | 1,280 | 172,000 |
| 2025-10 | Litter - SD - Retargeting | Sponsored Display | $890 | 1,340 | 205,000 |
| 2025-11 | Brand - SB - Top of Search | Sponsored Brands | $2,510 | 2,770 | 314,000 |
| 2025-11 | Litter - SBV - Product Page | Sponsored Brands Video | $1,240 | 1,610 | 209,000 |
| 2025-11 | Litter - SD - Retargeting | Sponsored Display | $1,700 | 2,350 | 292,000 |
Extract the first word or phrase before the first " - " delimiter in the campaign name to identify the product category. For example, "Litter - NBR - SBV Top" → category = "Litter". This lets you spread SB/SD spend across product categories in a CAC/LTV report.
Key Steps:
- Add a "Category" column using text extraction from campaign name
- Pivot by Category × spend_month for a clean spend-over-time view
- Combine with Q7 data to get total Sponsored spend (SP from Q7 + SB/SD from Q9)
Best Chart Types:
- Stacked bar: SB vs SD spend by category
- Line chart: Monthly SB/SD spend trends by category
- Treemap: Share of SB/SD spend by category
Why This Matters for CAC: Without Q9, you'd only have SP spend by ASIN (Q7). Many brands allocate significant budget to SB/SBV campaigns that don't have ASIN-level tracking. This query fills that gap by letting you map SB/SD spend to categories via campaign names.
Attribution & Acquisition
The most powerful queries in the library. These join purchase data with ad interaction data to determine how customers were acquired (organic vs. paid), attribute conversions to specific campaigns, and classify buyers as new-to-brand or repeat, all at the product level.
For each new customer, determines whether they ever clicked a Sponsored Ad or DSP ad before their first purchase. Classifies customers as "paid_touched" or "organic_only" and groups by cohort month. This is the simplest organic/paid split. It answers: "What percentage of our new customers were influenced by ads?"
Output Columns
| Column | Type | Description |
|---|---|---|
cohort_month | TIMESTAMP | Month of the customer's first purchase |
acquisition_type | TEXT | 'paid_touched' or 'organic_only' |
new_customers | INTEGER | Number of new customers in this segment |
AMC Tables Used
SQL Query
Sample Output
Example data shown below is illustrative; actual outputs will vary based on your AMC instance and date range.
| cohort_month | acquisition_type | new_customers |
|---|---|---|
| 2025-08 | Organic | 2,300 |
| 2025-08 | Paid | 1,370 |
| 2025-09 | Organic | 2,170 |
| 2025-09 | Paid | 1,480 |
| 2025-10 | Organic | 2,470 |
| 2025-10 | Paid | 1,700 |
This query uses a broad definition: a customer is "paid_touched" if they ever clicked any ad, even if that click wasn't directly before their purchase. This overestimates paid attribution compared to last-click models, but it's the correct approach for understanding ad influence across the full customer journey.
Recommended Pivot Table Setup:
- Rows: cohort_month
- Columns: acquisition_type
- Values: SUM of new_customers
Best Chart Types:
- 100% stacked bar: Organic vs paid mix over time (shows trend shifts)
- Line chart: Organic % over time: organic / (organic + paid)
- Area chart: Stacked area showing absolute new customer volume by type
Key Metrics:
Organic %= organic_only / (organic_only + paid_touched) × 100Paid CAC= Total ad spend (Q7 + Q8 + Q9) / paid_touched customersBlended CAC= Total ad spend / ALL new customers
Amazon's own attribution model, using the amazon_attributed_events_by_conversion_time table. Provides campaign-level attribution with new-to-brand flags, broken down by ad product type, campaign, and tracked ASIN. This is the most detailed attribution data available in AMC, but it only covers ad-attributed events (up to 25 months of data).
Output Columns
| Column | Type | Description |
|---|---|---|
conversion_month | TIMESTAMP | Month when the conversion occurred |
ad_product_type | TEXT | sponsored_products, sponsored_brands, sponsored_display, or NULL for DSP |
campaign | TEXT | Campaign name |
tracked_asin | TEXT | ASIN attributed to the conversion |
new_to_brand | BOOLEAN | Whether the purchaser is new to the brand |
customers | INTEGER | Unique customers |
purchases | INTEGER | Total purchases |
attributed_revenue | DECIMAL | Total attributed product sales |
ntb_purchases | INTEGER | New-to-brand purchase count |
ntb_revenue | DECIMAL | New-to-brand attributed revenue |
AMC Tables Used
SQL Query
Sample Output
Example data shown below is illustrative; actual outputs will vary based on your AMC instance and date range.
| conversion_month | ad_product_type | campaign | tracked_asin | customers | attributed_revenue |
|---|---|---|---|---|---|
| 2026-01 | Sponsored Products | Litter - SP - Exact - Top Keywords | B0EXAMPLE01 | 1,100 | $44,900 |
| 2026-01 | Sponsored Products | Bags - SP - Auto | B0EXAMPLE03 | 370 | $13,800 |
| 2026-01 | Sponsored Brands | Brand - SB - Top of Search | B0EXAMPLE01 | 290 | $11,600 |
| 2026-01 | Sponsored Display | Litter - SD - Retargeting | B0EXAMPLE01 | 170 | $6,800 |
| 2026-01 | DSP | Pet Care - DSP - Prospecting | B0EXAMPLE01 | 110 | $4,500 |
$58,70071.9%
$11,60014.2%
$6,8008.3%
$4,5005.5%
Unlike other date columns, conversion_event_date_utc requires an explicit CAST(... AS TIMESTAMP) before you can use DATE_TRUNC on it. Without the CAST, the query will fail.
The amazon_attributed_events_by_conversion_time table holds up to 25 months of data. For longer historical NTB/repeat analysis going back years, use Q13 instead.
Recommended Pivot Table Setup:
- Rows: ad_product_type (or campaign category)
- Columns: conversion_month
- Values: SUM of attributed_revenue, SUM of ntb_revenue
- Filter: tracked_asin (mapped to product category)
Key Calculated Fields:
NTB %= ntb_revenue / attributed_revenue × 100NTB ROAS= ntb_revenue / ad_spend (join with Q7/Q8/Q9)Attributed ROAS= attributed_revenue / ad_spend
Best Chart Types:
- Stacked bar: NTB vs repeat attributed revenue by ad type
- Line chart: NTB % trends over time by ad type
- Bubble chart: Campaign comparison: X = spend, Y = attributed revenue, size = NTB %
The ASIN-level version of Q10. For each new customer's first purchase, determines whether they were ad-touched, broken down by the specific ASIN they first bought. This enables product-level organic vs. paid analysis, essential for understanding which products drive organic acquisition and which depend on ads.
Output Columns
| Column | Type | Description |
|---|---|---|
cohort_month | TIMESTAMP | Month of first purchase |
asin | TEXT | ASIN of first purchase |
acquisition_type | TEXT | 'paid_touched' or 'organic_only' |
new_customers | INTEGER | Number of new customers |
AMC Tables Used
SQL Query
Sample Output
Example data shown below is illustrative; actual outputs will vary based on your AMC instance and date range.
| cohort_month | asin | product_name | acquisition_type | new_customers |
|---|---|---|---|---|
| 2026-01 | B0EXAMPLE01 | Cat Litter 40LB | Organic | 1,490 |
| 2026-01 | B0EXAMPLE01 | Cat Litter 40LB | Paid | 1,040 |
| 2026-01 | B0EXAMPLE02 | Puppy Pads | Organic | 740 |
| 2026-01 | B0EXAMPLE02 | Puppy Pads | Paid | 370 |
| 2026-01 | B0EXAMPLE03 | Waste Bags | Organic | 500 |
| 2026-01 | B0EXAMPLE03 | Waste Bags | Paid | 430 |
Litter
Pads
Shampoo
Mat
Q10 gives you the account-level organic/paid split. Q12 adds the ASIN dimension, letting you build product category filters. If product A is 90% organic and product B is 40% organic, you know exactly where your ads are driving acquisition and where organic brand strength carries the weight.
Recommended Pivot Table Setup:
- Rows: ASIN (mapped to product category)
- Columns: acquisition_type
- Values: SUM of new_customers
- Filter/Slicer: cohort_month (for time-based filtering)
Best Chart Types:
- 100% stacked bar: Organic vs paid % by product category
- Grouped bar chart: Absolute new customers: organic vs paid per category
- Line chart with category filter: Organic % trend over time for a selected category
Product Category Slicing: Create an ASIN → Category mapping, add as a column, then create a slicer/filter pill for category. This lets you toggle between "All Products", "Litter", "Grooming", etc. in your dashboard.
Classifies every purchase as New-to-Brand or Repeat based on whether it's the customer's first month purchasing from your brand. Unlike Q11 (which covers up to 25 months of ad-attributed data), this query spans the full retail history (up to 5 years) and covers ALL purchases, not just ad-attributed ones. The definitive NTB analysis query.
Output Columns
| Column | Type | Description |
|---|---|---|
purchase_month | TIMESTAMP | Month of purchase |
asin | TEXT | Product ASIN |
customer_type | TEXT | 'new_to_brand' or 'repeat' |
customers | INTEGER | Unique buyers |
units | INTEGER | Units sold |
revenue | DECIMAL | Total revenue |
AMC Tables Used
SQL Query
Sample Output
Example data shown below is illustrative; actual outputs will vary based on your AMC instance and date range.
| purchase_month | asin | product_name | customer_type | customers | units | revenue |
|---|---|---|---|---|---|---|
| 2026-01 | B0EXAMPLE01 | Cat Litter 40LB | NTB | 1,580 | 1,720 | $70,700 |
| 2026-01 | B0EXAMPLE01 | Cat Litter 40LB | Repeat | 950 | 1,210 | $33,500 |
| 2026-01 | B0EXAMPLE02 | Puppy Pads | NTB | 770 | 850 | $19,500 |
| 2026-01 | B0EXAMPLE02 | Puppy Pads | Repeat | 340 | 430 | $8,700 |
| 2026-01 | B0EXAMPLE03 | Waste Bags | NTB | 610 | 650 | $12,400 |
| 2026-01 | B0EXAMPLE03 | Waste Bags | Repeat | 320 | 360 | $6,400 |
A customer is "new_to_brand" if their purchase occurs in the same month as their very first purchase from your brand. All subsequent months = repeat. This is conservative: even if they buy a new product for the first time, if they've purchased ANY product before, they're classified as repeat.
This query can return 5,000–10,000+ rows (ASIN × month × customer_type). If it times out in AMC, add HAVING COUNT(DISTINCT rp.user_id) >= 5 to filter out very low-volume ASINs.
Recommended Pivot Table Setup:
- Rows: purchase_month
- Columns: customer_type
- Values: SUM of customers, SUM of revenue
- Filter/Slicer: ASIN (mapped to product category)
Best Chart Types:
- Stacked area chart: NTB vs repeat customers over time (shows the full history)
- 100% stacked bar: NTB % by product category
- Line chart: NTB % trend over time (new_to_brand / total × 100)
Calculated Fields:
NTB %= new_to_brand_customers / (new_to_brand + repeat) × 100NTB Revenue %= new_to_brand_revenue / total_revenue × 100Revenue per NTB Customer= new_to_brand_revenue / new_to_brand_customersRevenue per Repeat Customer= repeat_revenue / repeat_customers
Combine with Q12: Use Q12 (organic vs paid) + Q13 (NTB vs repeat) together to build a 2×2 matrix: Organic NTB, Organic Repeat, Paid NTB, Paid Repeat: the most complete customer acquisition view possible.
For each converting customer, identifies their very first ad touchpoint and attributes the conversion to that channel. Shows SP, SB, SD, DSP, or Organic breakdown with NTB rates. Essential for understanding which channels drive initial awareness and which types of customers each channel attracts.
Output Columns
| Column | Type | Description |
|---|---|---|
first_touch_channel | TEXT | Channel of first ad touchpoint (Sponsored Products, Sponsored Brands, Sponsored Display, DSP, or Organic) |
customer_count | INTEGER | Number of converting customers attributed to this channel |
total_revenue | DECIMAL | Total revenue from these customers |
total_units | INTEGER | Total units sold |
pct_of_customers | DECIMAL | Percentage of total converting customers |
avg_revenue_per_customer | DECIMAL | Average revenue per customer for this channel |
ntb_customer_count | INTEGER | Number of new-to-brand customers |
ntb_pct | DECIMAL | Percentage of customers who are NTB |
AMC Tables Used
SQL Query
Sample Output
Example data shown below is illustrative; actual outputs will vary based on your AMC instance and date range.
| first_touch_channel | customer_count | total_revenue | total_units | pct_of_customers | avg_revenue_per_customer | ntb_customer_count | ntb_pct |
|---|---|---|---|---|---|---|---|
| Sponsored Products | 11,680 | $310,300 | 14,600 | 60.8% | $26.57 | 7,610 | 65.2% |
| DSP | 3,790 | $120,800 | 4,740 | 19.7% | $31.87 | 1,280 | 33.8% |
| Sponsored Brands | 2,390 | $67,800 | 2,990 | 12.4% | $28.37 | 1,640 | 68.6% |
| Sponsored Display | 790 | $23,100 | 990 | 4.1% | $29.24 | 310 | 39.2% |
| Organic | 550 | $24,500 | 690 | 2.9% | $44.55 | 190 | 34.5% |
Sponsored Brands typically shows the highest NTB rate because it captures customers during brand discovery searches. SP dominates volume (60%+) but SB punches above its weight for new customer acquisition. Organic first-touch customers convert at the highest revenue per customer, proof that brand awareness pays off. Use integer codes instead of strings in CTEs to avoid AMC dropping labels through UNION ALL chains. The hardcoded dates in Q14 and Q15 must sit inside the date range you pick in the AMC UI, or the query returns zero rows.
Key Metrics to Calculate:
- Cost per First Touch: Combine with Q7/Q8 spend data to calculate acquisition cost by channel
- NTB Cost per Acquisition: Channel spend ÷ ntb_customer_count
- Revenue per NTB Customer: Filter to NTB only and compare avg_revenue across channels
Best Chart Types:
- Horizontal bar chart: Customer count by channel (as shown above)
- Grouped bar chart: NTB vs Repeat side by side per channel
- Pie/donut chart: Share of customers by first-touch channel
Strategic Insight: If SP dominates first-touch (>50%), you're heavily search-dependent; consider diversifying into DSP/SB for top-of-funnel growth. If Organic first-touch customers show higher avg revenue, that validates upper-funnel investment to build brand awareness before the search moment.
Maps the ad touchpoint journey for converting customers. It shows the first 5 touchpoints in sequence (e.g., "sponsored_products > dsp > sponsored_brands"). Reveals the most common paths customers take before purchasing, helping you understand which channel combinations drive the best outcomes.
Output Columns
| Column | Type | Description |
|---|---|---|
path | TEXT | Sequence of up to 5 ad touchpoints separated by " > " |
customers | INTEGER | Number of customers who followed this path |
revenue | DECIMAL | Total revenue from customers on this path |
rev_per_customer | DECIMAL | Average revenue per customer on this path |
AMC Tables Used
SQL Query
Sample Output
Example data shown below is illustrative; actual outputs will vary based on your AMC instance and date range.
| path | customers | revenue | rev_per_customer |
|---|---|---|---|
| sponsored_products | 7,700 | $296,700 | $38.53 |
| sponsored_products > sponsored_products | 2,770 | $123,400 | $44.55 |
| dsp > sponsored_products | 1,310 | $64,200 | $49.01 |
| sponsored_brands > sponsored_products | 1,100 | $56,200 | $51.09 |
| sponsored_products > dsp > sponsored_products | 740 | $40,400 | $54.59 |
| dsp | 590 | $22,500 | $38.14 |
| sponsored_products > sponsored_brands > sponsored_products | 520 | $29,600 | $56.92 |
| dsp > sponsored_products > sponsored_products | 430 | $23,100 | $53.72 |
Add HAVING COUNT(*) >= 50 to filter noise paths. The most actionable insight here is which ad types appear as the FIRST touch in high-revenue paths; that tells you where to invest top-of-funnel budget.
Recommended Analysis:
- Sort by rev_per_customer DESC: multi-touch paths almost always have higher value per customer
- Group by first touchpoint: extract the first element of each path to see top-of-funnel channel performance
- Group by path length: compare 1-touch vs 2-touch vs 3+ touch conversion value
Best Chart Types:
- Horizontal bar chart: Top paths by customer count (as shown above)
- Sankey/flow diagram: If you have visualization tools that support it, Sankey charts are ideal for path data
- Scatter plot: Customers (x) vs Rev/Customer (y) to find high-value paths
Combine with Q14: Use Q14 for channel-level first-touch summary, then Q15 to understand the full journey. Together they answer "where do customers start?" and "what path do they take?"
Custom Dashboards & Reporting
Live, white-label dashboards that track TACOS with retail, ads, DSP, SQP and AMC widgets across your catalog. Stop sending static spreadsheets; give clients and stakeholders real-time access to the metrics that matter.
Try Free →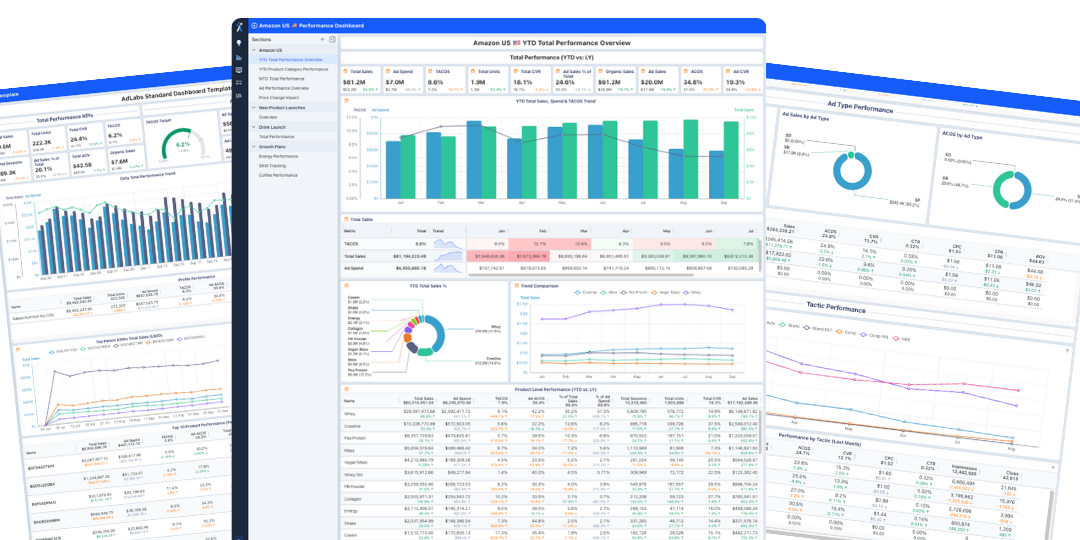
AMC Tables Reference
The five core AMC tables used across this query library. Each table contains many more columns than listed here; these are the key columns relevant to the queries in this guide.
amazon_retail_purchases
The core retail purchases table. Contains every purchase made by customers of your brand on Amazon. Used by 9 of the 15 queries in this library.
| Column | Type | Notes |
|---|---|---|
user_id | TEXT | ⛔ Non-viewable; used for JOINs and COUNT(DISTINCT) only |
asin | TEXT | Product ASIN |
asin_name | TEXT | Product name |
purchase_date_utc | TIMESTAMP | Purchase date; use with DATE_TRUNC |
purchase_dt_utc | TIMESTAMP | Purchase datetime; use for SECONDS_BETWEEN |
purchase_day_utc | INTEGER | Day number; usable for ORDER BY in window functions |
purchase_id | TEXT | Unique order identifier |
unit_price | DECIMAL | Price per unit in dollars (already converted) |
purchase_units_sold | INTEGER | Units in this line item |
purchase_program_name | TEXT | Subscribe & Save indicator (may be empty) |
sponsored_ads_traffic
All Sponsored Products, Sponsored Brands, and Sponsored Display traffic events: impressions, clicks, and spend. Used by Q7, Q9, Q10, Q12, Q14, and Q15.
| Column | Type | Notes |
|---|---|---|
user_id | TEXT | ⛔ Non-viewable |
event_date_utc | TIMESTAMP | Use this for DATE_TRUNC (not event_day_utc) |
creative_asin | TEXT | ASIN shown in the ad; may be empty for SB/SD |
ad_product_type | TEXT | sponsored_products, sponsored_brands, sponsored_display |
campaign | TEXT | Campaign name |
campaign_id | TEXT | Campaign ID |
spend | BIGINT | ⚠️ In microcents; divide by 100,000,000 for dollars |
clicks | INTEGER | Number of clicks |
impressions | INTEGER | Number of impressions |
dsp_impressions
DSP impression-level data with spend information. Used by Q8 for DSP spend tracking, and by Q14 and Q15 for touchpoints.
| Column | Type | Notes |
|---|---|---|
user_id | TEXT | ⛔ Non-viewable |
impression_date_utc | TIMESTAMP | Use this for DATE_TRUNC (not impression_day_utc) |
campaign | TEXT | DSP campaign name |
campaign_id | TEXT | DSP campaign ID |
total_cost | BIGINT | ⚠️ In millicents; divide by 100,000 for dollars |
impressions | INTEGER | Number of impressions |
dsp_clicks
DSP click-level data. Used by Q10 and Q12 to determine if a customer was "ad-touched" via DSP.
| Column | Type | Notes |
|---|---|---|
user_id | TEXT | ⛔ Non-viewable |
click_date_utc | TIMESTAMP | Click timestamp |
campaign | TEXT | DSP campaign name |
clicks | INTEGER | Number of clicks |
amazon_attributed_events_by_conversion_time
Amazon's attribution table, the largest table (392 columns). Links ad traffic to conversion events. Used by Q11 for full-funnel attribution and by Q14 for conversions.
| Column | Type | Notes |
|---|---|---|
user_id | TEXT | ⛔ Non-viewable |
conversion_event_date_utc | TEXT | ⚠️ Requires CAST(... AS TIMESTAMP) before DATE_TRUNC |
ad_product_type | TEXT | Ad type that drove the conversion (NULL for DSP) |
campaign | TEXT | Campaign name |
tracked_asin | TEXT | ASIN attributed to the conversion |
new_to_brand | BOOLEAN | Amazon's NTB flag |
purchases | INTEGER | Number of attributed purchases |
total_product_sales | DECIMAL | Total attributed sales revenue |
new_to_brand_purchases | INTEGER | NTB purchase count |
new_to_brand_total_product_sales | DECIMAL | NTB revenue |