Why This Guide Exists
There's no shortage of advice about Amazon ranking. Most of it is wrong.
Not wrong in an obvious way. Wrong in a dangerous way: close enough to the truth to sound credible, but missing the nuance that separates sellers who rank from sellers who burn money trying.
Through AdLabs, we see $1B+ in annual ad spend managed across 6,500+ advertisers. We've worked with 7-figure private label sellers and 9-figure CPG companies. We've tested ranking strategies that worked brilliantly and ranking strategies that cratered. We've tested, iterated, and refined our understanding of how this algorithm actually behaves.
This guide is the distillation of all of it.
No hype. No "one weird trick." Just the math, the mechanics, and the mental models that actually explain how Amazon decides which product shows up first.
If you're an experienced seller or agency operator, this is the definitive resource. Bookmark it.
How Amazon Ranking Actually Works
Amazon Is a Search Engine. Treat It Like One.
Before we talk tactics, we need to get the fundamentals right. Amazon is a search engine. A customer types something in. Amazon returns results. The algorithm's entire purpose is simple:
Put the right product in front of the right search.
Think about what a search engine actually does. You type something in, you get results. The entire system is trying to match the output to the most likely result you were looking for. Amazon is no different.
That's it. Amazon doesn't care about your brand story. Amazon doesn't care about your margin. Amazon cares about one thing: if a customer searches "ceiling fans," which product is most likely to make that customer happy, and make Amazon money in the process? (This is also why your product listing optimization matters so much: it's how you communicate relevancy to the algorithm.)
Every ranking decision flows from this.
The Formula: Performance × Relevancy
Here's the clearest way to think about Amazon's ranking algorithm:
Performance is your product's track record, but think about it from Amazon's perspective. Amazon is asking three things: Does this product make me money? (revenue generated, margins on FBA fees, ad spend). Do customers like it? (conversion rate, reviews, ratings, return rate). Do shoppers engage with it? (click-through rate, time on page, add-to-cart rate). The stronger your signal across all three, the more Amazon wants to show you.
Relevancy goes deeper than most people think. Yes, it includes on-page SEO: is the keyword in your title, bullets, backend search terms? But that's only the surface layer.
Think of relevancy in terms of search intent. Amazon is asking: when someone types this query, how likely is it that your product is what they're looking for? And more importantly, are they likely to browse or convert? Amazon wants to surface the product most likely to result in a purchase for any given search.
This is where branded search becomes a massive relevancy signal. When customers search "[Brand] whey protein" instead of "whey protein," Amazon learns that your brand IS the intent. Bigger brands naturally accumulate more branded search volume, which builds a compounding relevancy advantage across their entire catalog. They rank more efficiently on broader terms because Amazon has strong data that people searching in that category often end up buying that brand anyway.
External traffic reinforces this. When customers arrive from Google, TikTok, or influencer links already looking for your product, that traffic pattern signals to Amazon that your product has demand beyond the marketplace. It's another layer of relevancy that pure on-page optimization can't replicate.
Here's why the multiplication matters. If your performance score is 1,000 but your relevancy score is 0.5 (because you only have a broad match of the keyword in your listing), your ranking score is 500. A competitor with a performance score of 600 but perfect relevancy (1.0) gets a ranking score of 600.
They outrank you. Despite being a worse product. Because their listing is better optimized for that specific search term.
We've seen it countless times: a competitor who performs worse than you (lower click-through, lower conversion rate, fewer units) can rank higher simply because they wrote "diaper bag" in their title. They've established a perfect relevancy score.
This is one of the most underappreciated dynamics in Amazon ranking.
Here's where most ranking guides get it wrong. They talk about "rolling 7-day averages" or "30-day windows" as if the algorithm uses a single time frame.
It doesn't.
Here's one of the most specific algorithmic details we've come across:
The Amazon ranking algorithm doesn't use a single look-back period. It maintains a one-day average, a three-day average, a seven-day average, a 15-day average, a 30-day average, and then goes back even further: two, three, four, six months.
The critical insight: the further back you go, the less it's weighted. Yesterday's sales matter more than last month's. But last month's still matter.
This has massive implications:
- Going out of stock for 30+ days is devastating because you're accumulating zeros across every lookback window: your 1-day, 3-day, 7-day, 15-day, and 30-day averages are all zero.
- Short-term spikes (like a Lightning Deal) move the needle on 1-day and 3-day averages but fade quickly if not sustained.
- Consistent performance over 30+ days builds a foundation that's very hard for competitors to displace.
This is why 30 days is the magic number for deal strategies. More on that in Part 9.
Here's something most sellers don't realize: you might already have ranking credit sitting in the bank that you haven't cashed in.
Think of it this way: performance credits accumulate based on your sales history, even if your relevancy is poor. It's like money in a vault you can't access because you lost the key.
Your performance score has been sitting in the bank the whole time. To cash it in, you need the relevancy key. Go in, write your listing to unlock it, take your relevancy score from 0.5 back to 1.0 by writing that keyword in the title in exact form, and you can impact your rank immediately.
We've seen hundreds and hundreds of cases where rewriting one keyword into the title in exact form caused an immediate jump from page 5 (or not indexed at all) to page 1.
This isn't a slow grind. It can happen overnight. The performance was already there. The listing just wasn't telling Amazon about it.
If you have an established product with strong sales but mediocre keyword rankings, audit your title first. Make sure your highest-value keywords appear in exact match form, front-loaded in the title. You may be sitting on a performance bank you've never cashed in.
Amazon ranking is a flywheel. Better ranking → more visibility → more sales → even better ranking → even more visibility.
This is why the gap between position 1 and position 10 isn't linear. Position 1 doesn't get 10× more sales than position 10. In competitive categories, it can get 50× or 100× more. The flywheel compounds.
And this is why Amazon rewards bigger brands. It's not favoritism. It's math. An established supplement company that's been on Amazon for a decade has years of performance data, thousands of reviews, proven conversion rates, and brand recognition that drives click-through.
We've seen this firsthand with established brands. When a supplement company that's been on Amazon for a decade launches a new product, it's tremendously easier for them to build momentum. Amazon is clearly factoring in a brand's overall presence and track record.
New brands don't get that benefit. They have to earn it from zero. That's not unfair. That's how trust works.
What Amazon Actually Cares About (Two Things)
We can simplify everything above into two questions Amazon asks about every product:
- Does the customer like you? (conversion rate, reviews, low returns)
- Does Amazon like you? (how much revenue does Amazon make from you: FBA fees, referral fees, ad spend)
If both answers are yes, you rank. If one answer is no, you struggle. If both are no, you're invisible.
Amazon's algorithm isn't mysterious. It's self-interested. Amazon makes money when customers find products they love, buy them, and don't return them. Every ranking signal (conversion rate, reviews, price, shipping speed) is a proxy for "will this customer be happy?" The more reliably you make customers happy (and make Amazon money doing it), the higher you rank. Full stop.
The Complete Ranking Factor Stack
| Factor | Why It Matters | Impact |
|---|---|---|
| Conversion rate | The single most important signal. Proves customers want your product. | Critical |
| Sales velocity | Rolling averages across 1/3/7/15/30-day windows | Critical |
| Keyword relevancy | Multiplier on your performance score | Critical |
| Inventory/stock status | Stockouts tank every lookback window simultaneously | Critical |
| FBA vs. FBM | FBA = Prime badge = higher CVR = higher ranking (category-dependent; less critical for high-AOV categories like mattresses) | Critical |
| Click-through rate | Proves your listing attracts attention in search results | High |
| Price competitiveness | Directly impacts CVR and Amazon's revenue calculation | High |
| Reviews & ratings | Social proof that compounds over time | High |
| Return rates | High returns signal unhappy customers and directly impact the "happiness index" | High |
| Product history/tenure | Longer track record = more algorithm trust | Medium-High |
| Brand quality score | Established brands get a halo effect on new products | Medium-High |
| Amazon's revenue from you | FBA fees, referral fees, ad spend: Amazon's cut | Medium-High |
The foundation matters most: nothing above works without the Critical factors below
BSR: What It Really Means
BSR Is Not What You Think It Is
Best Sellers Rank might be the most misunderstood metric on Amazon. Sellers obsess over it. They shouldn't, at least not in the way most do.
Here's what BSR actually is: a relative sales index within a category, measured against all of Amazon. That's it. It tells you how your recent sales velocity compares to other products. #1 BSR means you've sold the most units in that category within the algorithm's time window.
This "relative to all of Amazon" part matters. Your BSR isn't just compared to direct competitors. It's influenced by overall marketplace activity. A space heater that's #500 in its category during winter might slip to #2,000 in summer, not because competitors overtook it, but because absolute sales volume dropped and products in other categories are outselling it on the broader Amazon scale. Your keyword rank (position on search results) can stay perfectly stable while your BSR dips, because keyword rank is relative to your category competitors, while BSR reflects your position in the broader Amazon ecosystem.
Category path BSRs: understand the hierarchy. Every product on Amazon has BSR rankings at multiple levels of the category tree. A whey protein powder might simultaneously be:
- #2 in Whey Protein Powders (deepest subcategory)
- #8 in Protein Powders (parent category)
- #45 in Sports Nutrition (broader)
- #1,200 in Health & Household (top-level)
Each level tells you something different. The deepest subcategory BSR is the most useful for competitive analysis: it's your rank against your closest competitors. The top-level BSR is almost meaningless for day-to-day decisions because you're being compared against millions of products across completely unrelated categories. When tracking BSR, always focus on the most specific subcategory relevant to your product.
It does NOT tell you:
- How you rank for any specific keyword
- How visible you are in search results
- Whether your product is actually profitable
- Anything about your PPC performance
BSR = how you're selling relative to your category. Category-level.
Keyword rank = where you appear when someone searches a specific term. Keyword-level.
If you have a strong BSR, you're almost certainly ranking well on your most important search terms, because that's where the sales volume is coming from. But the reverse is where people get fooled: you can rank #1 on a low-volume long-tail keyword and think you're winning, when in reality that #1 position barely moves the needle because nobody's searching for it. High rank on a low-volume term ≠ sales. Volume matters as much as position.
The bottom line: BSR and keyword rank are related but they measure different things. BSR is a lagging indicator of your overall sales velocity within a category. Keyword rank is driven by Performance × Relevancy on a per-keyword basis. It's about how well you convert on that specific search term. Understanding the difference is how you stop chasing vanity metrics and start focusing on what actually drives revenue.
Treating BSR improvement as proof that your ranking strategy is working. BSR can improve because of a sale spike from a deal, external traffic, or seasonal demand, none of which necessarily means your organic keyword positions have improved. Track keyword rank directly.
If you track historical BSR alongside unit sales, you'll notice that a single zero-sales day doesn't crash your BSR to infinity. There's a momentum-based component: BSR slowly climbs as you sell more, and slowly falls when sales dip. It's smoothed, not instantaneous.
This means:
- A single big sales day won't permanently change your BSR
- Consistent sales over weeks will set a new BSR floor
- A stockout won't immediately destroy BSR (but give it a few days and it craters)
This is exactly why deals and coupons create temporary BSR spikes. Run a Lightning Deal and you'll see BSR jump, but once the deal ends, it slowly drifts back down as your sales normalize to their baseline. The spike is real but not permanent on its own.
Here's where it gets interesting: sellers who run routine deals over time (stacking Lightning Deals, coupons, and promotions at regular intervals) can see steady, sustained BSR improvement.
Each deal sends a velocity signal to Amazon. Stack enough of those signals within the rolling lookback windows and you're not just spiking and fading. You're building a new, higher floor.
The algorithm sees consistent demand, not a one-off event. Over time, that compounding effect can meaningfully shift your baseline BSR in a way a single deal never could.
BSR matters when:
- You're tracking relative competitive position within a category over time
- You're evaluating the impact of deals (before/during/after BSR shifts)
- You're estimating competitors' sales volume (tools like Keepa use BSR for this)
- You're making inventory planning decisions
BSR doesn't matter when:
- You're trying to understand keyword-level performance
- You're evaluating PPC campaign effectiveness
- You're comparing across different categories (BSR #100 in "Cell Phones" ≠ BSR #100 in "Artisanal Cheese Knives")
Amazon's Choice vs. Overall Pick
These are two separate badges that coexist and serve different purposes:
- Amazon's Choice: A keyword/search term-level recommendation badge. When someone searches a specific term, Amazon flags one product as the best match. It's keyword-specific, not universal. You earn it per search term, and it can change.
- Overall Pick: A broader, category-level recommendation that highlights a top all-around option. It signals high relevance, quality, and value at the category level rather than for a specific search query.
Both badges signal high relevance, quality, and value, but they're triggered by slightly different algorithms and use cases. In practice, the same high-performing ASIN can hold both badges on different queries. When you see a competitor with either badge, understand which type it is. It tells you whether they're winning a specific keyword or dominating a category.
Keyword Ranking: The Real Game
This Is Where the Money Is
If BSR is a vanity metric with limited tactical value, keyword ranking is the real game. Where you appear when a customer types in a specific search term: that's what drives organic sales.
And organic sales are the holy grail. No ad spend. No ACOS. Pure profit margin.
Organic rank and PPC performance aren't separate worlds. They work in tandem. If you have a strong product that "deserves" to rank by all the indicators we've covered, your ads will work. You'll rank. The criteria feed each other.
Monitoring your organic rank regularly gives you direct insight into whether specific strategies are working: pushing spend on a certain term, running a deal, optimizing a listing. It's the feedback loop that tells you if your efforts are actually moving the needle.
The Relevancy Hierarchy
Not all keyword placements are created equal. There's a clear hierarchy:
- Title (exact match, front-loaded) → Highest relevancy score
- Title (exact match, later position) → High
- Title (broad match/words scattered) → Medium-High
- Bullet points → Medium
- Backend search terms → Medium-Low
- A+ Content → Low (and possibly not indexed for all terms)
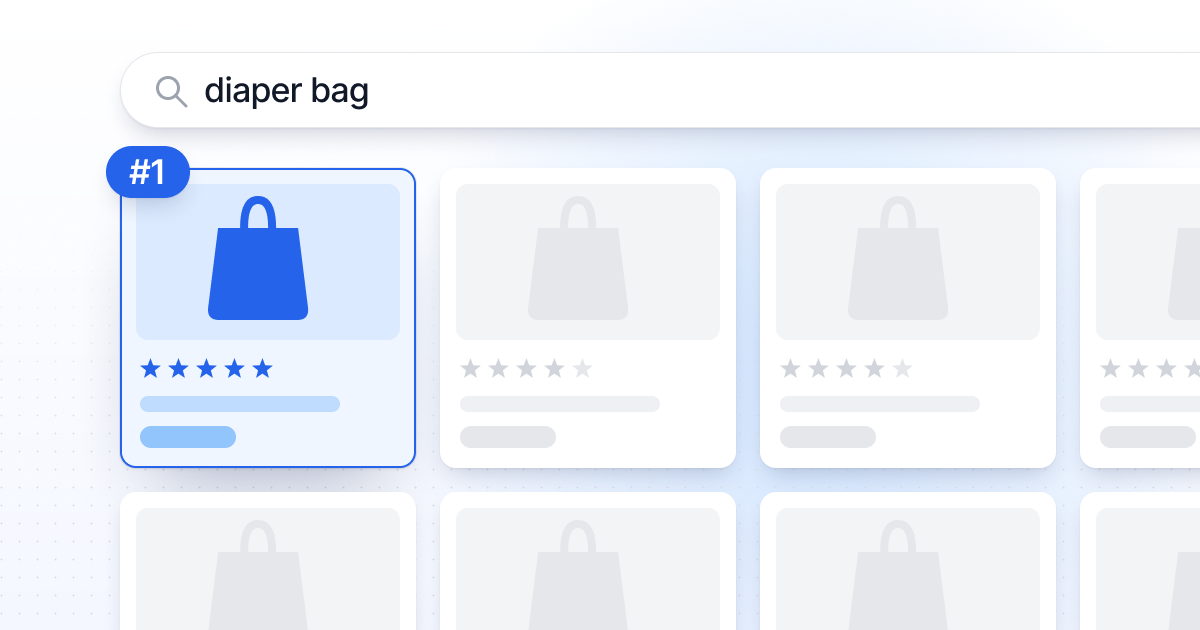
If you want to rank for "diaper bag," the most powerful thing you can do is put "diaper bag" as the first words in your title. In exact match form. Not "bag for diapers." Not "diaper travel bag." The exact phrase: "diaper bag." Choosing the right keywords to prioritize starts with a disciplined keyword harvesting process.
This is the part most people miss. It's not just total sales that drive keyword ranking. It's sales attributed to that specific keyword.
When a customer searches "organic protein powder," clicks your product, and buys, that sale is attributed to the keyword "organic protein powder." That specific attribution is what drives your ranking for that specific term.
This is why you can theoretically rank high for some keywords and low for others, even within the same product. Your performance history is keyword-specific.
A common misconception: moving a keyword to a new campaign doesn't reset its history. Amazon doesn't forget the performance your product has built on that keyword just because you restructured your campaigns. The history lives at the ASIN-keyword level, not the campaign level.
The "Deserved Rank" Concept
This is one of the most important mental models in Amazon ranking:
Your product has a "deserved rank" for any given keyword: the position it naturally settles into based on its conversion rate, price, reviews, and overall offer quality relative to the competition.
You can temporarily push above your deserved rank with aggressive PPC or deals. But when you pull back? You drift right back to where you were.
We've seen this pattern repeatedly: you push from position 45 up to position 30 with aggressive tactics, but the moment you raise price back up, you drift right back to 45, regardless of PPC spend. That's your deserved rank telling you something.
Before investing in ranking campaigns, honestly assess your deserved rank. Compare your conversion rate to the market average using SQP data. If you're significantly below, fix your offer first. No campaign structure can overcome a fundamentally uncompetitive product.
Amazon's Search Query Performance (SQP) dashboard gives you something no other platform does: a full-funnel view of how your brand performs on every search term, broken into four stages.
We call it the ICAP funnel: Impressions, Clicks, Add-to-Carts, Purchases:
- Impression Share: What percentage of total impressions for a keyword is your brand capturing? This includes both organic and sponsored impressions. If your impression share is 5%, you're barely visible. If it's 40%, you're dominating.
- Click Share: Of all the clicks happening on a search term, what percentage goes to your products? This tells you how well your main image, title, price, and reviews are working relative to competitors. It's your CTR benchmarked against the entire market, not just your own campaigns.
- Add-to-Cart Share: Of all add-to-cart actions on a search term, what percentage is yours? This is the mid-funnel signal. If your click share is high but your add-to-cart share drops off, customers are landing on your PDP but something is stopping them: price, reviews, content, or a competitor's listing is simply more compelling.
- Purchase Share: Of all purchases made from a search term, what percentage went to you? This is the ultimate metric. It tells you how much of the actual revenue on that keyword you're capturing.
Why this matters for ranking: These metrics let you diagnose exactly where you're losing in the funnel. If your impression share is strong but click share is weak, your main image or price isn't competitive. If click share is strong but purchase share drops, your PDP isn't converting; maybe reviews, A+ content, or pricing needs work.
The real power is in troubleshooting. Say your sales are down year over year on a keyword. SQP might reveal that total search volume is down across the board, but your impression share, click share, and purchase share are actually up. You're capturing more of a smaller pie. That's a completely different story than losing market share, and it changes your strategy entirely.
Track these alongside keyword rank to get the complete picture. Rank tells you your position. SQP tells you whether that position is actually translating into market share at every stage of the buying journey.
Complete the view with PPC metrics. Layer in your search term impression share and search term impression rank from the advertising console alongside your SQP data. This tells you how competitive your ads are relative to other advertisers on that term. When you combine organic rank, SQP funnel metrics, and PPC impression data, you get a holistic understanding of the keyword-to-product relationship: where you sit in the market, how customers move through the purchase journey, and whether your advertising is pulling its weight.
Spotting Ranking Opportunities: Where You Outperform Market CVR
One of the most actionable things you can do in SQP is identify keywords where your ASIN's conversion rate outperforms the market average. If you're converting above market on a term but your impression share or rank is low, that's a clear signal: you deserve to rank higher, and the effort to push there is likely to pay off.
The caveat: volume has to justify the effort. Outperforming market CVR on a keyword that gets 50 searches a month isn't worth a ranking campaign. But outperforming on a keyword with 10,000+ monthly searches? That's where you deploy resources aggressively. The algorithm is already telling you that customers who find you on this term like what they see.
What Drives Click Share (and What Kills It)
If your impression share is healthy but your click share is lagging, something on the search results page is costing you clicks. The three biggest levers:
- Main image. This is your billboard on the SERP. It's the single biggest driver of whether someone clicks on you or scrolls past. A/B test relentlessly: small changes in angle, lighting, packaging visibility, or lifestyle context can move click share significantly.
- Price. Customers see your price before they click. If you're $5 above every competitor on the page, your click share will suffer regardless of how good your product is. Price doesn't need to be the lowest, but it needs to be competitive enough that shoppers don't filter you out before they even visit your page.
- Star rating and review count. Here's the subtle one: Amazon rounds star ratings on the SERP. If your true rating drops from 4.3 to 4.2, Amazon may display you as 4.0 stars instead of 4.5 stars on the search results page. That visual drop from a half-filled star to a round number can tank click share overnight, even though your actual rating only moved 0.1 points. Monitor your displayed star rating, not just your true average. The thresholds where Amazon rounds down (4.25, 3.75, etc.) are critical inflection points.
See Your Market Share Per Keyword
Search Query Performance shows exactly how much market share you're capturing per keyword. See the gaps. Close them. AdLabs makes SQP data actionable, not just a dashboard you check once a month.
Try Free →
Conversion Rate: The Master Lever
If You Remember One Thing From This Guide, Remember This
Conversion rate is the single most important ranking factor on Amazon.
Every expert we've spoken to confirms this. Every dataset we've analyzed supports it. If we could only optimize one metric for organic ranking, it would be conversion rate. Every single time.
Conversion rate is the single most important metric when it comes to ranking. If your product isn't converting, why would Amazon show it? Every impression that doesn't convert is a lost sale for Amazon.
The logic is simple: Amazon makes money when products sell. A product that converts 20% of visitors into buyers generates far more value to Amazon than a product that converts 5%. Amazon will always favor the product that converts.
Your CVR vs. Market CVR
Your absolute conversion rate doesn't matter as much as your conversion rate relative to competition on the same keyword.
If your ASIN's conversion rate is below market average, you're not going to hold a top 10 organic position. The target: get your CVR at least one to two percentage points above your market conversion rate. That's the threshold where Amazon starts rewarding you with better placement.
The 20% Benchmark for CPG Categories
If you're in consumables, supplements, health & wellness, or any CPG-adjacent category:
Realistically to compete in these really competitive categories, especially with CPG verticals, you're going to need at least a 20% conversion rate just to keep up with competition.
When You CAN'T Rank Higher: The CVR Ceiling
This is the hard truth nobody wants to hear.
Sometimes your product simply can't rank higher. Not because of your PPC strategy, your listing quality, or your bid management. Because your conversion rate has a ceiling, and that ceiling is below what the top-ranked products achieve.
Blaming PPC performance when organic ranking won't improve. If your conversion rate is below the market average, the problem isn't your campaigns. It's your product, your price, your images, or your reviews. Fix the offer before increasing the spend.
Before a customer can convert, they have to click. Click-through rate is the gateway metric that makes conversion rate possible.
Top of search has dramatically higher CTR than other placements. We've seen data showing 10-50× higher CTR at top of search compared to product page placements.
What drives CTR on Amazon?
- Main image: this is your ad creative, the first thing shoppers see
- Title: specifically the first 60-80 characters visible in search results
- Price: appears in search results, price competitiveness drives clicks
- Star rating and review count: social proof at a glance
- Badges: Best Seller, Overall Pick, coupon badges, deal badges
Your main image IS your CTR strategy. Everything else (title, price, reviews) is harder to change quickly. But you can A/B test your main image this week. If your CTR is below the market average, start there.
Everything You Can Control
PDP Optimization: Your Listing Is Your Foundation
Your product detail page is the one thing you have complete control over. And it's a direct input to both the relevancy multiplier and conversion rate.
- Front-load your highest-volume exact match keyword
- Include secondary keywords in natural language
- Don't keyword stuff: Amazon can penalize you, and it tanks CTR
- Remember: title is the highest-weight relevancy signal
- Focus on benefit-driven copy that addresses customer concerns
- Include secondary keywords naturally
- Answer the questions that cause shoppers to hesitate
- Keep them scannable, since most shoppers skim
- Use all available character space
- Include misspellings, Spanish translations, synonyms
- Don't repeat words already in your title or bullets
- No commas needed: Amazon parses individual words
- A+ content improves conversion rate (even if indexing value is debated)
- Use comparison charts to prevent shoppers from leaving your page
- Brand Story module keeps shoppers in your ecosystem
- Focus on lifestyle imagery that helps shoppers visualize owning the product
Image Strategy
Think of your images as a two-part strategy: Main image drives CTR (what shoppers see in search results), and secondary images drive CVR (once someone clicks).
Test your main image obsessively. Tools like PickFu, IntelliVy, and Sella Matrix let you A/B test before going live. Even a 10% improvement in CTR cascades through your entire ranking performance.
Don't stop at the main image. Test your supporting graphics too. Frame them around benefits, not features. Pull your main value props and messaging directly from customer reviews. The language your buyers use to describe why they love (or hate) the product is the most persuasive copy you'll ever write. Your image stack should answer every objection and reinforce every benefit before a customer ever reads a bullet point.
Pricing Strategy: A Direct Ranking Throttle
Price affects everything: conversion rate, click-through rate, Amazon's revenue calculation, and competitive position. The "deserved rank" concept is heavily price-dependent. The impact depends on how significant the change is relative to the price point. A $5 increase on a $500 product might barely move the needle. A $5 increase on a $10 product is a 50% price hike, and it can absolutely tank your conversion rate and ranking along with it.
This is also why you're seeing aggressive overseas sellers (particularly from China) dominate certain categories. They can operate on razor-thin margins that domestic brands can't match, undercut on price, win the conversion rate game, and climb the rankings. Pair that with some less-than-legitimate tactics (review manipulation, search-find-buy schemes, and other black hat methods), and you've got competitors who are nearly impossible to outrank on price alone. The answer isn't to race to the bottom.
Compete on value, brand, and the factors they can't fake: authentic reviews, brand loyalty, and a product people actually come back to buy again.
That doesn't mean you should always be the cheapest. It means you need to understand where your price positions you in the market, and whether your conversion rate supports your price point.
Reviews affect ranking through their impact on conversion rate. More reviews = higher consumer confidence = higher CVR = higher ranking.
But it's not just quantity. It's the combination of:
- Review count: threshold effects, going from 10 to 100 reviews is massive
- Star rating: 4.3 vs. 4.7 matters more than most sellers realize
- Review velocity: recent reviews signal continued product quality
- Review content: photos, detail, verified purchase badges
Getting initial reviews is critical for launches. Methods that work: Amazon Vine, insert cards (keep it TOS-compliant), and follow-up email sequences using Amazon's built-in tools.
Reviews as Your Voice of the Customer
Beyond their impact on conversion, reviews are the most honest feedback loop you have. They're your customers telling you, in their own words, whether you deserve to win or not.
Mine your reviews for two things:
- Product feedback. What do customers love? What do they complain about? If the same issue appears across multiple reviews, that's not noise. It's a signal that your product needs to improve. The brands that iterate based on this feedback are the ones that build lasting ranking advantages, because they're actually making the product better.
- Customer language. Pay attention to how customers describe your product, what they use it for, and what problem it solves for them. That language should go straight into your listing copy: title, bullets, A+ content. When your listing speaks the way your customers think, relevancy improves, conversion improves, and ranking follows. Don't guess at keywords in a vacuum. Let your buyers tell you how they talk about your product.
The best sellers don't just collect reviews. They study them and iterate. New images, updated bullet points, product improvements, even new variations, all driven by what customers are actually saying.
Inventory Management: Stockouts Are Ranking Death
We cannot overstate this: going out of stock is the single most destructive thing that can happen to your organic ranking.
Remember those multiple lookback windows from Part 1? When you're out of stock, every single window is accumulating zeros. Your 1-day average is zero. Your 3-day average is dropping. Your 7-day average is cratering. Your 15-day and 30-day averages are eroding.
If your supply chain can't maintain consistent inventory, that's a ranking problem, not just an operations problem. Factor ranking recovery costs into your stockout calculations. The true cost of a 30-day stockout isn't just the lost revenue. It's the 60-90 days of rebuilding rank afterward.
FBA vs. FBM: Category Context Matters
For most categories, FBA is absolutely essential. The Prime badge increases conversion rate, and higher conversion rate improves ranking. Beyond the badge, FBA gives you shipping speed and delivery reliability, both direct CVR drivers.
That said, it's category-dependent. In high-AOV categories like mattresses or adjustable beds, customers don't expect overnight delivery, so FBM sellers can compete more effectively. But in CPG, supplements, electronics, and most consumables? FBA isn't optional. It's critical.
Locational Inventory: The Hidden Ranking Factor
Where your inventory is physically located affects your ranking. If your products are only in one FBA warehouse on the East Coast, West Coast customers see longer delivery times. Longer delivery times reduce conversion. Lower conversion hurts ranking.
How to monitor this: Seller Central's FBA inventory reports can show you which fulfillment centers are holding your stock. If you see inventory concentrated in one or two regions, that's a red flag: customers in underserved areas are getting slower delivery and you're losing conversions you'll never see.
SQP takes this a step further. The dashboard includes shipping speed columns (same-day, 1-day, and 2-day delivery) showing you how your impressions, clicks, and purchases break down by the shipping speed that was displayed to the customer. If you notice a larger share of your purchases shifting toward 2-day delivery, that can signal you're running low on stock in certain regional warehouses. Conversely, if most of your purchases come from same-day or 1-day, your distribution is healthy and working in your favor.
Video Content
Video on your listing improves conversion rate. Period. It helps shoppers see the product in use, understand its size and features, and make a confident purchase decision. If you have Brand Registry and aren't using video, you're leaving CVR (and therefore ranking) on the table.
Everything You Can't Control (But Must Monitor)
Competitor Actions and Market Shifts
Your ranking is relative. You can do everything right and still lose position because a competitor did something better.
New entrants, price cuts, improved listings, aggressive PPC: all of these change the competitive landscape. A brand can lose organic ranking not because they did anything wrong, but because the market fundamentally shifted. Tools like n-gram analysis can help you identify which search terms are shifting and where competitors are gaining ground.
What to monitor:
- Competitor pricing changes (Keepa is invaluable here)
- New entrants in your top keyword search results
- Competitor review velocity (are they gaining faster than you?)
- Market conversion rate trends in SQP
Seasonality Effects
Seasonality affects volume, not necessarily rank. Since rank is relative, if you're #3 for "space heater" in January, you should still be roughly #3 in July, because everyone else's volume dropped too. What seasonality does affect is your overall BSR (since that's tied to absolute sales velocity across all of Amazon) and total revenue. Don't confuse an overall BSR dip in a slow season with a ranking problem. Your position relative to competitors may be perfectly stable; there's just less search volume to go around in your category.
Algorithm Updates
Amazon updates its algorithm regularly without announcement. When rankings shift across your catalog in ways that don't correlate with anything you did, the worst thing you can do is panic and make drastic changes. Monitor for a few days. See if things stabilize.
External Market Forces
We've seen cases where a viral TikTok video about a supplement category didn't spike traffic for any particular brand, but the entire category grew 5 to 10× year over year in search volume. External attention lifts the whole tide.
When a category grows 10×, rankings shuffle dramatically. This can work for you or against you, and it's entirely outside your control.
Search Volume: The Ceiling You Can't Break Through
This might be the most overlooked factor in all of Amazon ranking: search volume dictates the size of the opportunity. You can rank #1 for a keyword, have the best product, the best listing, the best conversion rate, and still see declining sales if the search volume behind that keyword is shrinking.
Macro trends trickle down into micro niches. If consumer interest in a category is declining (maybe a health trend faded, a competing product category emerged, or the economy shifted spending patterns), every seller in that space feels it. Your rank stays the same. Your conversion rate stays the same. But there are simply fewer people searching.
This is where SQP becomes essential. If total search volume is down but your impression share, click share, and purchase share are steady or growing, you're doing everything right. You're just in a shrinking market. That's a fundamentally different problem than losing competitive position, and it requires a fundamentally different solution.
When you're ranked at the top but volume is declining, your options are limited:
- Stimulate demand through brand building. Go upper-funnel. Invest in content, social presence, and awareness campaigns that make people search for your category (or better yet, your brand) in the first place.
- Off-platform marketing. Social media, influencer campaigns, PR, and content marketing can drive new search volume that didn't exist before. This is the only way to create demand, not just capture existing demand.
- DSP and upper-funnel Amazon ads. In theory, DSP can drive awareness and consideration. In practice, most legitimate case studies we've seen show limited effectiveness at actually stimulating new search demand. It can help with retargeting and staying top-of-mind, but it's rarely the demand-creation engine brands hope it will be. If you do go this route, leverage AMC (Amazon Marketing Cloud) for granular audience targeting and apply strict negatives and viewability minimums to make sure your spend is actually reaching real humans, not padding impressions. AMC is also essential for proving incrementality. Without it, you're guessing whether DSP actually drove new demand or just took credit for sales that would've happened anyway.
- Accept and adapt. Sometimes a category is simply in secular decline. No amount of optimization changes that. The smart move might be expanding into adjacent categories or launching complementary products rather than fighting a losing volume battle.
The key insight: ranking is a market share game, not an absolute game. If you're #1 in a category that gets 100 searches a month, you're still only going to get a fraction of those 100 searches. Understanding the volume ceiling (and whether it's growing, stable, or shrinking) is just as important as understanding your rank within it.
Off-Platform Influence: How Influencers Drive On-Platform Visibility
One of the strongest correlations we've observed in recent years: the direct relationship between off-platform influencer activity and on-platform branded search growth.
When a brand invests in influencer partnerships (product reviews, YouTube videos, TikTok content, Instagram giveaways), the first thing that happens isn't a flood of affiliate link clicks. It's a spike in branded search on Amazon. People see a product on social media, then go to Amazon and search for it by name.
That branded search is an incredibly powerful ranking signal. As we covered earlier, branded search builds a compounding relevancy advantage: Amazon sees that customers searching in your category often end up searching specifically for your brand. That association bleeds into non-branded search results too: Amazon starts showing your product more aggressively on generic keywords because it has data showing you're what people want.
Branded search is also incredibly efficient. You already paid for that customer off-platform, through the influencer, the social ad, the content that drove them to Amazon. You shouldn't need to keep cannibalizing branded terms with heavy PPC spend unless absolutely necessary.
Defend your key placements on brand terms if necessary, but don't over-invest there. Try a holdout test: pause brand defense for a period and watch whether your purchase share actually drops. If it doesn't, you were paying for clicks you would've gotten organically.
The exception: if your brand name is synonymous with a product category (think Kleenex, Band-Aid, Chapstick), competitors will aggressively target your branded terms because those searches carry massive commercial intent. In those cases, brand defense isn't optional. It's survival.
The real benefit is that this efficiency on branded traffic gives you headroom to be more aggressive on non-brand and competitive terms, the campaigns that actually grow market share. A strong branded search baseline effectively subsidizes your ranking efforts on the keywords that matter most.
What we've seen specifically:
- Direct, measurable correlation between dollars spent on influencer partnerships and branded search volume growth
- Influencer video launches (especially YouTube and TikTok) creating immediate branded search spikes within 24-48 hours
- Sustained influencer programs (not one-off posts) building a steadily rising baseline of branded search over months
- The halo effect extending beyond the promoted product: a viral protein powder video lifts branded search for the entire brand catalog
This is why brands that treat Amazon as an island (optimizing only on-platform) eventually hit a ceiling. The brands that break through are the ones driving demand from the outside in. The ranking algorithm rewards you for it because branded search converts at dramatically higher rates than generic search, and Amazon notices.
If you're serious about long-term organic ranking growth, your strategy can't live entirely inside Amazon. It has to include the channels that drive people to Amazon looking for you by name.
PPC and Organic Ranking: The Real Relationship
The Biggest Misconception in Amazon Advertising
Let's kill the biggest myth in Amazon PPC:
Keyword spend does NOT equal keyword ranking. You cannot buy your way to the top of organic rankings.
We've seen it fail. Repeatedly. Across hundreds of accounts.
What PPC Actually Does
PPC doesn't directly improve ranking. But it does something critically important: it gives Amazon a chance to test your product. For a comprehensive breakdown of how to audit and optimize your PPC campaigns, see our PPC Audit & Optimization Guide.
If you're not appearing anywhere on page one for a keyword and you're not running any ads on it, you'll likely never reach page one. Amazon hasn't had a chance to test your product for that search term. PPC is how you buy that audition.
Think of PPC as an audition. You're paying for stage time. What happens during that audition (whether customers click and convert) determines whether Amazon gives you a permanent spot on the roster.
PPC Can Hurt Your Ranking
Here's the part that makes most PPC managers uncomfortable: if your product performs poorly in sponsored positions, you're actually telling Amazon it doesn't deserve to rank.
Running aggressive ranking campaigns on keywords where your conversion rate is below the market average. You're not building rank. You're proving to Amazon that you don't belong there. Fix your conversion rate first, then run the campaigns.
Total Advertising Cost of Sales (TACOS), your total ad spend divided by total revenue (organic + paid), is the best metric for measuring whether PPC is contributing to organic growth.
If your TACOS is declining over time while total revenue grows, that's the halo effect in action. Your PPC spending is generating organic momentum that's compounding.
If your TACOS is flat or increasing, your PPC isn't generating organic lift. You're on an ad spend treadmill. Strategies like dayparting can help improve PPC efficiency by focusing spend on high-converting hours.
We don't know for certain whether Amazon treats PPC conversions the same as organic conversions for ranking purposes.
Here's the honest truth: we don't know with certainty whether Amazon categorizes PPC conversions separately from organic conversions in its ranking algorithm, or if it's a combined score. Nobody outside Amazon does. What we do know is that PPC-driven sales clearly contribute to ranking momentum.
What we do know: PPC-driven sales velocity contributes to your overall sales history, which impacts BSR and your performance across lookback windows. Whether the per-conversion ranking credit is equal, we honestly can't say.
The Bottom Line on PPC and Ranking
Think of PPC as a ranking catalyst, not a ranking cause. It accelerates what was already going to happen based on your product quality and offer competitiveness. The key is getting your bid optimization right so you're spending efficiently during that acceleration.
Bad product + PPC → Faster proof you don't belong ✗
Good product + no PPC → Slow organic growth (if ever)
Bad product + no PPC → No ranking at all
Ranking Campaign Strategy
What Ranking Campaigns Are (and Aren't)
A ranking campaign is a PPC campaign specifically designed to improve your organic position for a target keyword. It's not a normal sales-driving campaign with profitability targets. The goal is to generate enough sales velocity on a specific keyword to push your organic position up.
But here's what a ranking campaign is NOT: a magic wand. It's not "spend more = rank higher."
Campaign Structure: Single Keyword, Maximum Control
This structure gives you clean data, precise budget control, and clear performance signals. It's the exact structure we use internally. For a deeper dive into when to use SPAGs vs. SKWs, see our Campaign Structure Guide.
Many sellers believe ranking campaigns should have "no ACOS target": just spend whatever it takes. We disagree. Strongly.
Here's the math with the same $1,000 budget:
- Scenario A (100% ACOS target): Optimized bids, refined placements → $1,000 in sales
- Scenario B (200% ACOS, no target): Unoptimized, just spending → $500 in sales
Same spend. Half the sales. The seller running without an ACOS target actually generates fewer sales because they're not optimizing for efficiency.
Setting a ranking campaign ACOS target at 100% (break-even) or even 150% doesn't mean you're being conservative. It means you're forcing the algorithm and your own optimization process to maximize sales per dollar spent. "No target" doesn't mean "more sales." It often means "more waste."
Yes, top of search typically has the highest conversion rates. But it also has the highest CPCs, sometimes 500% higher than other placements.
Top of search typically has the best conversion rates, but it's not the only placement driving conversions. If you're trying to move units for ranking, you want visibility everywhere, not just position one.
If your goal is maximum sales velocity (which is the whole point of a ranking campaign), it's about maximizing sales velocity across all placements for your target keywords within the target ACOS, not just fighting for the most expensive spot. One exception: since August 10, 2026, Sponsored Products also serve off Amazon, including in creator content, and those clicks don't come from a search on your keyword. For a ranking campaign, consider the campaign's "Limit off-Amazon spend" setting.
Here's an advanced concept that most sellers miss: you can rank for a keyword without directly targeting it.
Your performance on related keywords directly influences your ranking on others. Dominate the long-tail variations of "ceiling fans" ("ceiling fans with lights," "flush mount ceiling fan," "outdoor ceiling fan") and your rank on the head term improves as a byproduct. The cumulative sales velocity signals to Amazon that you're a top result for the entire keyword cluster, not just one search term.
This is why we often recommend a portfolio approach: don't just target the head term. Target the 10-20 long-tail variations around it. Collectively, those sales build enough momentum to impact the head term too.
Keyword Selection for Ranking Campaigns
Duration
- Minimum: 2 weeks (need at least a full 14-day rolling average to shift)
- Sweet spot: 4-6 weeks (covers the 30-day lookback window completely)
- Maximum: Until you've reached your organic rank target OR proven it's not going to work
Success Signals
- Organic rank improving week-over-week for the target keyword
- Impression share increasing
- TACOS declining (organic sales replacing ad-driven sales)
- BSR improving
Failure Signals
- Organic rank flat or declining despite increased spend
- Conversion rate below market average on the target keyword
- TACOS flat or increasing
- Needing to increase bids just to maintain the same position
When to Stop
- You've hit your organic rank target and can maintain it with reduced spend
- Four weeks of data show no organic rank improvement despite good CVR
- Your CVR on the target keyword is consistently below market
- Budget reallocation to another keyword would yield better ROI
Launching Products: The Complete Playbook
The Cold Start Reality
Let's dispense with the biggest launch myth immediately: the 60-day honeymoon period does not exist. Not in the way most sellers think.
There's no 30 or 60-day honeymoon period. From the very beginning, Amazon compares your product to similar products and the search terms those products convert on, then starts testing your product in those same searches. The "cold start" happens in hours, not months.
Hours. Not months. Hours.
This means your listing must be PERFECT from day one. There is no "soft launch where I'll fix the listing later." By the time you fix it, the algorithm has already formed an opinion, and it's not a good one.
The Launch Trilemma
Every product launch faces a fundamental constraint. You can optimize for three things, but you can only have two:
Sacrifice one.
Strategy 1: Profitable from the start (slow growth)
Pick volume + profitability. Sacrifice speed. Grow steadily, never lose money, but accept that ranking will take months. Best for side-project brands, limited capital, risk-averse sellers. Timeline: 6-12+ months.
Strategy 2: Break-even (balanced approach)
Pick volume + speed. Sacrifice short-term profitability. Target break-even ACOS and push for ranking while covering costs. Best for most brands. Timeline: 2-4 months.
Strategy 3: Rank-driven (sell at a loss)
Pick speed + volume. Sacrifice profitability entirely. Aggressive spend, deep discounts, maximum velocity. Best for established brands with cash flow. Timeline: 4-8 weeks.
The 11-Step Launch Framework
Step 1: Identify Root Keywords
Use SQP data, Product Opportunity Explorer, and Brand Analytics. Focus on first-party Amazon data; third-party estimates are less reliable. Our Keyword Research Guide covers the systematic approach to discovering and validating keywords.
Before launch, create a dummy FBM listing for your ASIN. Send a small amount of traffic to it and fulfill 10-20 orders. This gets you SQP data before your real launch, letting you validate keywords with actual Amazon data.
Step 2: Validate Keywords
Compare your ASIN's conversion rate to the market rate using SQP data. Only target keywords where you're 1-2% above market conversion rate.
Step 3: Understand the Three Ranking Pillars
- Relevancy (listing optimization)
- Visibility (advertising and placement)
- Offer (price, images, reviews)
Step 4: Build Keyword Relevance Early
During launch, use exact match campaigns only. Target your validated keywords with surgical precision. Do NOT run auto campaigns. They'll scatter your relevancy signal and confuse the algorithm about what your product is.
Step 5: Launch PPC Campaigns
Single keyword campaigns. One campaign, one ad group, one ASIN. Start with exact match on your top 3-5 keywords. The most important KPI during launch is the conversion rate of that specific campaign.
Step 6: Measure Visibility
Track top of search impression share. Spend on top of search aggressively to maximize visibility for your target terms.
Step 7: Optimize the Offer
Three elements that matter most at launch: title (with target keyword exact match, front-loaded), price point (competitive or below market), and main image (tested and optimized pre-launch).
Step 8: Test and Iterate
Use PickFu, IntelliVy, or Sella Matrix for main image testing before you even launch. Don't guess. Test.
Step 9: Track Organic Rank
Use DataDive's Rank Radar and Helium 10's Keyword Tracker (with Boost on) for hourly rank tracking during launches.
Step 10: Expand to the Next Keyword Set
Once you've established rank for your first set of keywords, apply the same process to the next tier. Expand methodically. Don't try to rank for 50 keywords at once.
Step 11: Retest Keywords Over Time
This is the step most sellers skip, and it's one of the most important. Just because a keyword didn't work during launch doesn't mean it won't work six months later.
Think about it: since launch, you've accumulated more reviews, improved your listing copy, maybe upgraded your images, refined your pricing. Your product is fundamentally stronger now. The product/keyword signal Amazon formed during your first attempt is stale. It deserves a fresh look.
This is exactly why we prefer cycling keywords between low-visibility and high-spend states rather than pausing them entirely. A paused keyword sends Amazon zero signal. But a keyword that periodically moves from low-vis back to aggressive spend gives Amazon a fresh data point: a chance to re-evaluate what it thinks about your product on that search term. Over time, as your product improves, those fresh signals start telling a better story.
Build retesting into your ongoing strategy. Every quarter, revisit keywords you deprioritized and give them another shot. Your product today isn't the same product it was at launch, and Amazon's opinion of it shouldn't be frozen in time either.
Deal Laddering Strategy: The 30-Day Window
Deals are one of the most powerful ranking tools available, but only if you use them correctly. The key insight is the 30-day lookback window.
If you run a deal and then wait five weeks for the next one, you lose the compounding effect. But if you run deals within 30 days of each other, you get a blended average of conversion rate from both deals. The lookback window stacks them together, creating a sustained velocity signal.
The strategy:
- Run your first deal (Lightning Deal, 7-Day Deal, or coupon promotion)
- Within 30 days, run another deal
- Repeat 3-5 times within overlapping 30-day windows
- Each deal benefits from the elevated baseline of the previous deal
When you're running deals, you're not just boosting your own performance. You're actively suppressing competitor conversion rates by capturing their potential customers. Once you get ahead, continue running deals, not just to push your rank, but to starve your competitors.
Two-Click Keyword Harvesting & Negation
AdLabs surfaces your winning search terms and your waste. Harvest winners into the right campaign in two clicks and negate waste in bulk, so your campaigns get smarter every week. Stop manually mining search term reports. You review, AdLabs does the busywork.
Try Free →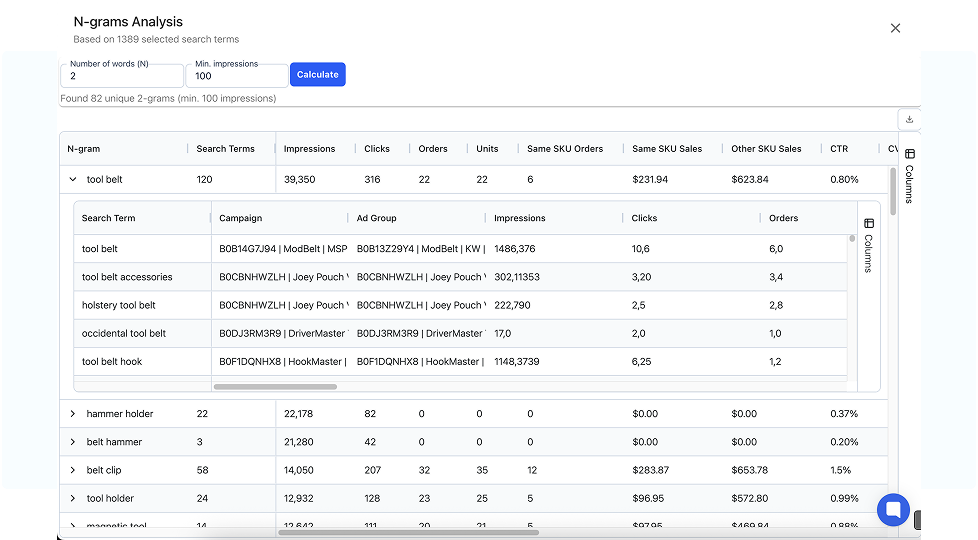
Coupon Strategy: Protect Your Price Floor
Coupons boost CTR and conversion (the green badge catches eyes) without impacting your lowest-in-30-days price. Run an evergreen coupon and set your list price slightly higher. You get badge visibility without compromising future deal pricing.
The Strikethrough Pricing Hack
Create a new FBM listing for your ASIN. Set it 25-30% higher than your target price. Buy it yourself. Wait 3-4 days and Amazon automatically gives you strikethrough pricing. Then launch at your target retail price, get 3-10 sales, add the regular FBA pricing, and start lowering your price to earn the "lowest in the last 30 days" badge.
Starting Bids for Launches
If you don't have PPC data yet, use revenue per session as a proxy. Launch ACOS target: break-even, with a ceiling of 2× break-even if needed. For the full RPC bidding methodology, see the Bid Optimization Guide.
For starting bids, there's no universal number. It's entirely dependent on your product and category. Amazon provides suggested bids, but don't just plug those in as your base bid. Remember that suggested bids don't account for placement modifiers. Set your base bid below the suggested amount, then use placement modifiers informed by your account or product-level averages (or category benchmarks if launching fresh). This pre-sets your campaigns closer to their likely placement allocation from day one, so you spend less time and budget finding the right balance.
Check this against current Amazon policy first: Amazon's Seller Code of Conduct guidance names search-find-buy schemes as search-rank manipulation. Services like Sellico run rebate campaigns where real shoppers search for your target keyword on Amazon, find your product, and purchase it at full price (reimbursed afterward). The result: real purchase velocity tied to a specific search term: exactly the signal Amazon's algorithm uses to determine rank.
Why this matters so much at launch:
- Keyword-specific signal: Unlike organic purchases that might come from browse or brand searches, these are tied directly to the keywords you're trying to rank for
- Full-price transactions: Amazon weighs full-price sales more heavily than steeply discounted ones (more on this below)
- Drip scheduling: You control the pace: spread units over days or weeks to create a natural-looking velocity curve instead of a suspicious one-day spike
- Calculated launch cost: You know exactly what each unit costs (product cost + rebate), so you can budget the total investment needed to reach a target rank
Not all sales are created equal in Amazon's eyes. A $30 product sold at full retail price sends a stronger ranking signal than that same product sold at $5 through a deep coupon stack or Lightning Deal. Amazon makes more money on full-price transactions, and the algorithm reflects that. Heavily discounted sales simply don't carry the same weight.
This is one of the biggest advantages of search-find-buy giveaways. The rebate happens off-platform, completely outside of Amazon's ecosystem. As far as Amazon is concerned, it's a clean, full-margin purchase at your retail price. You get the velocity you need for ranking without diluting the quality of the signal.
Think of it as seeding the algorithm. PPC alone can struggle to generate enough initial velocity, especially in competitive categories where you're bidding against established products with thousands of reviews. A well-timed search-find-buy campaign gives your product the initial push it needs, and then PPC and organic momentum take over from there.
The math is straightforward: estimate the daily sales velocity of products currently ranking where you want to be, calculate how many units you need at that pace for 7-14 days, and that's your launch giveaway budget. Combine this with your PPC campaigns, deals, and listing optimization. It's not a replacement for those, it's the accelerant.
External traffic sources that work for launches:
- TikTok: biggest organic potential right now
- Instagram: especially for visually-driven products
- Influencer/affiliate programs: Archer Affiliates, Levanta
- Email lists: if you have an existing audience
- Facebook/Google ads direct to Amazon
If your external traffic drives product-category searches instead of brand-name searches, you're growing the entire category, not just your sales. Your creative must sell the BRAND, not just the product category.
If you're driving direct traffic to Amazon from other platforms, use Amazon Attribution to track which channels are actually generating sales and measure their contribution. It's free for brand-registered sellers and gives you campaign-level visibility into external traffic performance. Without it, you're flying blind on ROI.
Amazon also offers a Brand Referral Bonus (typically ~10% back on sales driven through Attribution links) as an incentive for bringing external traffic. In theory it's a great deal, but in practice, the results have been mixed. We've had clients report that the tracking wasn't reliable and the bonus didn't always credit properly. Worth setting up since it's free, but don't build your business case around the rebate actually showing up consistently.
Diagnosing Ranking Changes
The Diagnostic Mindset
Ranking changes happen. The question isn't if your ranking will shift. It's why, and what to do about it.
Framework for Investigating Ranking Drops
When you see organic rankings decline, work through this diagnostic tree:
- Is it seasonal? Compare year-over-year trends. Don't panic if this is historically slow.
- Is it algorithmic? Are multiple products across categories shifting? Monitor before reacting.
- Is it competitive? Check SERPs. New competitor? Price cuts? Use Keepa.
- Is it your conversion rate? Check SQP. Most common cause, often disguised as a "ranking problem."
- Is it a listing issue? Amazon sometimes makes unauthorized changes to titles, bullets, images, or even parentages.
- Is it inventory-related? Even partial stockouts at certain fulfillment centers can hurt.
Unexpected ranking improvements deserve investigation too. If you don't understand why you went up, you won't know how to maintain it.
Common causes:
- A major competitor went out of stock
- A competitor raised prices significantly
- Seasonal demand surge for your category
- External traffic source driving sales (TikTok virality, PR mention)
- Algorithm update that favored your listing profile
- Recent review influx improving your conversion rate
The Sales Troubleshooting Formula
This tells you exactly WHERE the problem lives:
Don't guess. Decompose. The formula above tells you exactly what changed. Most sellers see declining sales and start adjusting bids. But if the problem is conversion rate, bid changes won't help. If the problem is impressions, listing changes won't help. Diagnose before you treat.
Key Metrics to Monitor
| Metric | Frequency | What It Tells You | Where to Find It |
|---|---|---|---|
| Keyword rank (top 10-20) | Daily | Your organic position on key terms | DataDive Rank Radar, Helium 10 |
| BSR (subcategory) | Daily | Relative sales velocity in your category | Amazon listing, Keepa |
| Conversion rate (by keyword) | Weekly / Monthly | Whether your offer is competitive per search term | SQP, Campaign Manager |
| Impression share | Weekly / Monthly | Your visibility relative to competitors | Search Term Impression Report |
| Click share | Weekly / Monthly; ad hoc when testing main images, analyzing review star changes, etc. | How much of the click volume you're capturing | Brand Analytics |
| Market CVR | Monthly / Quarterly | The benchmark your CVR is measured against | SQP |
DataDive Rank Radar
Our preferred tool for keyword rank tracking. The heat map visualization is unmatched: you can see your PPC performance, impression share, competitive positioning, and organic ranking all in one view.
Helium 10
Best for hourly rank tracking using the Boost feature in Keyword Tracker. Critical during launches and ranking campaigns when you need granular data.
Brand Analytics / SQP
First-party Amazon data. Best for comparing your conversion rate to market averages and tracking click share and conversion share by keyword.
Keepa
Best for historical price and BSR tracking. Invaluable for competitive analysis and understanding deal impact.
Dashboards That Actually Tell You What Changed
Custom dashboards that track TACOS, organic %, and total performance, with shareable live links, not static spreadsheets. Diagnose ranking changes in minutes, not hours.
Try Free →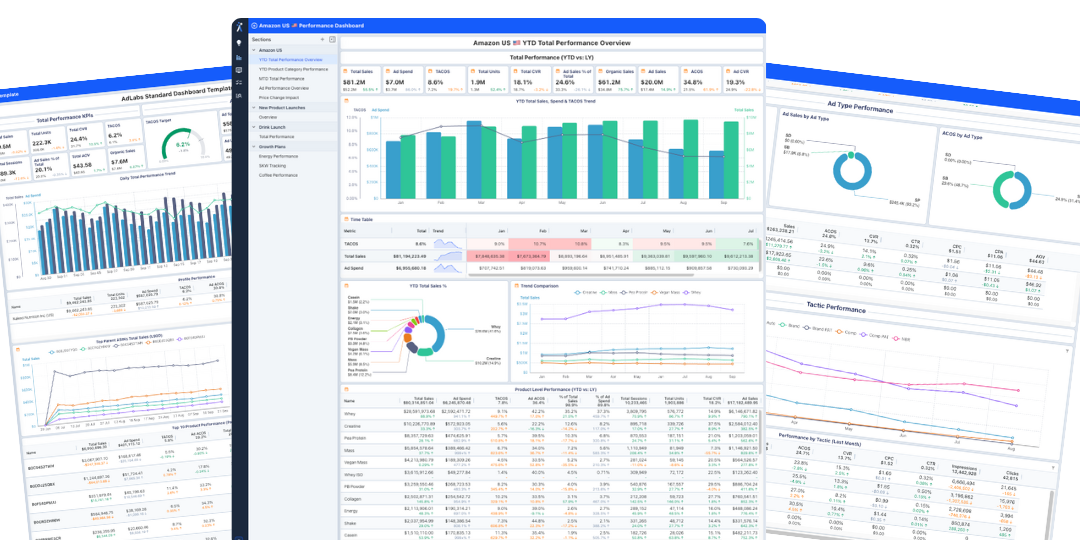
When Ranking Issues Are Actually CVR Issues in Disguise
This is worth its own section because we see it constantly.
A seller comes to us and says: "My ranking dropped. I need a better PPC strategy."
We look at the data. Their ranking dropped because their conversion rate dropped. Their conversion rate dropped because a competitor cut their price by 20%. Or their star rating dropped. Or their main image looks dated compared to new entrants.
The ranking change is a symptom. The cause is almost always price competitiveness, CVR decline, review/rating degradation, or listing quality relative to improving competitors.
Every time ranking drops, ask "Is this a ranking problem or a conversion rate problem?" Nine times out of ten, it's a conversion rate problem. And conversion rate problems are solved with offer improvements, not campaign structure changes.
The Ranking Mindset
Ranking Is the Outcome, Not the Strategy
After this entire guide, here's what it all comes down to:
Organic ranking is the result of doing everything else right. It's not something you "do." It's something that happens when your product is genuinely good, your listing is optimized, your price is competitive, your reviews are strong, and your advertising gives Amazon the data it needs to confirm all of the above.
Focus on Being the Best Result
At the end of the day, Amazon just wants the best product first. The brands consistently winning the top spot aren't gaming the system. They simply have the best product. Everything else is optimization around that core truth.
Amazon's algorithm, with all its complexity (the lookback windows, the relevancy multipliers, the performance banks), is fundamentally trying to answer one question:
Which product will make this customer the happiest?
If the answer is your product, you'll rank. If it's not, no amount of PPC spend, deal laddering, or campaign structure will save you.
The Sustainable Approach
- Build a great product
- Create a compelling offer (price, images, reviews, listing)
- Use PPC to give Amazon the data it needs to discover you deserve to rank
- Use deals and promotions to accelerate the flywheel
- Monitor and adapt as the competitive landscape shifts
The AdLabs Philosophy
We believe in being semi-automatic and data-driven, with humans in control. We don't believe in set-it-and-forget-it automation that promises to "hack" the algorithm. We don't believe in throwing unlimited budget at ranking campaigns with no ACOS target. We don't believe in treating PPC as a substitute for product quality.
We believe in understanding the math. Tracking the data. Making informed decisions. And accepting that sometimes the answer isn't "spend more." It's "improve your product."
Ranking on Amazon isn't a mystery. It's math. And if you've made it through this guide, you now understand the math better than 99% of sellers on the platform.
Use it wisely.
This guide is based on years of managing hundreds of Amazon advertising accounts, combined with research from That Amazon Ads Podcast and our team's deep expertise in PPC-driven organic growth.